Annex 16. Example of using Gini to measure dispersion in stunting among children in Kenya
The following example calculates Gini for child undernutrition among children in Kenya using data from the 2022 Demographic and Health Survey. The sample includes children aged five years and younger. Undernutrition is measured using negative height-for-age z-scores (which is related to stunting), censored at 0 and multiplied by −1. A larger absolute value of this measure indicates that a child’s height is further below the median height of a child of the same age and sex in a well-nourished population.
Figure A16.1 shows the Lorenz curve for undernutrition of children aged under five years in Kenya in 2022. The Lorenz curve (blue line) initially runs along the x-axis because some children are taller than the well-nourished median, so they are censored at 0. The curve lies well below the black 45-degree line, indicating there is variation in the extent to which Kenyan children were stunted in 2022.
FIGURE A16.1. Lorenz curve of child undernutrition, Kenya
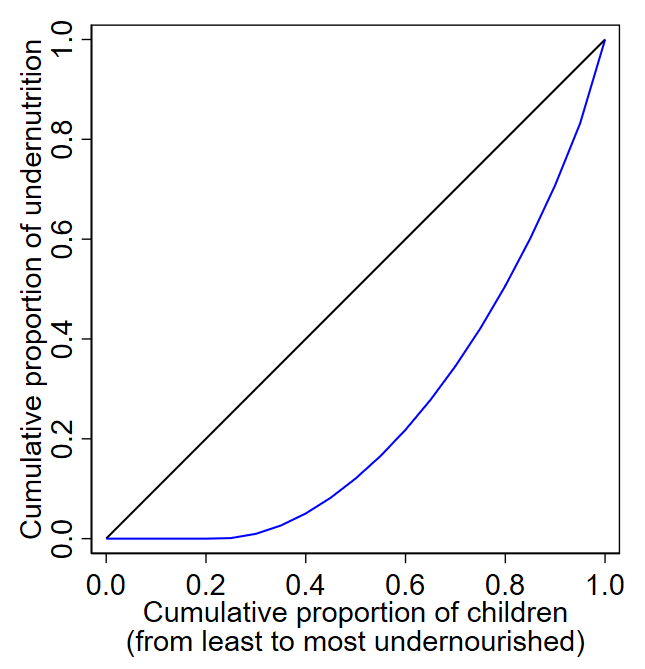
The black 45-degree line represents a situation of equality. The blue line represents the Lorenz curve, a situation of inequality.
Source: data were sourced from the 2022 Kenya Demographic and Health Survey.
The Gini index for child stunting in 2022 is 0.515 or 51.5%. The Gini index is more meaningful when comparing across indicators, time periods or settings. For example, Table A16.1 compares the Gini index in 2008, 2014 and 2022. The variation in stunting increased slightly, from 45.7% in 2008 to 51.5% in 2022.
TABLE A16.1. Gini index: child stunting, Kenya
| 2008 | 2014 | 2022 | |
|---|---|---|---|
| Gini coefficient | 0.457 | 0.472 | 0.515 |
| Gini index (%) | 45.7 | 47.2 | 51.5 |
Source: data were sourced from the 2008, 2014 and 2022 Kenya Demographic and Health Surveys.