Chapter 16. Emerging and novel data sources
Overview
Over the past decades, there has been an emergence of novel data sources and technological advancements of existing sources that have potential application to health inequality monitoring. The data sources discussed in this chapter – including geospatial data, mobile and web-based surveys, health tracking applications and digital public health surveillance (DPHS) – can enable data collection in near real time and at fast speeds. These sources can collect data at granular levels, at large volumes, and pertaining to a large number of people, often with low resource inputs. Data collection through these sources may be done for the purposes of monitoring health or inequality dimensions, or for other purposes. These data sources have existed for some time but are rapidly developing and gaining more recognition in the field of population health monitoring.
Rapid advancements in technology have enabled the collection of an increasingly higher volume of data at increased quality. There is ever-growing analytical and computational power and the ability to link information across data sources. Artificial intelligence has a rapidly developing role in streamlining and accelerating how data are collected, processed and analysed (1). The resulting “big data” – datasets characterized by huge volumes of frequently updated data that may be collected through means such as the internet, mobile phones and satellite imagery (2) – offer new opportunities to better understand how health varies across different population groups. The relevance of digital health – the development and use of digital technologies to enhance the efficiency, accessibility and quality of health systems (3) – has been recognized widely in accelerating achievement of universal health coverage and advancing global development goals (4, 5).
The objectives of this chapter are to introduce the key characteristics of a selection of emerging data sources (although these are not exhaustive) and to discuss their strengths and limitations for health inequality monitoring. These sources may provide data inputs for the preparation and analysis of disaggregated data and summary measures of health inequality (see Chapter 17–22), but they are also particularly relevant to the further inequality analysis techniques discussed in Chapter 25.
Ethical considerations for data use and access
As the application of technology for the collection and use of data grows, increased consideration of ethical issues is warranted, including those pertaining to ensuring inclusivity and equity, protecting privacy and confidentiality, and fostering transparency and trust, such as establishing fair data ownership and accessibility protocols. Inequalities in access to and use of digital technologies, including mobile devices and internet connectivity – the “digital divide” – create population bias in data collection using digital tools. Knowledge and technical skills differ greatly across population groups (e.g. social and age groups) and ownership and use of digital technology (6, 7). Differences in terms of network connectivity, access to electricity, usability of devices, and integration with existing information technology systems are other contributing factors (8). Individuals may be hesitant to share sensitive health information on digital platforms, fearing potential misuse or breaches of confidentiality – especially people from communities experiencing historical or contemporary marginalization and people at risk of discrimination. Making data available that pinpoint populations that experience disadvantage may put those populations at risk of being further marginalized. There is an ethical responsibility to protect information through privacy and confidentiality standards. Transparency in how data are used can help build trust between the public and public health systems. Users need to be aware of and provide consent for the collection and use of their data.
Equitable access to digital resources and long-term investment in the underlying infrastructure, data standards, governance and analytical capacity are vital prerequisites for inequality monitoring data sources. The WHO Classification of digital interventions, services and applications in health supports the process of planning and implementing digital health components to address health system challenges and advance health goals (9). For digital health safety, transparent and reliable regulatory frameworks are needed to ensure the use of data is transparent and privacy rights are protected, including personal identifiable information and protected health information (10). For more information about data governance and data security considerations, see Chapter 4.
Geospatial data and technologies
Geospatial data are data about objects, events or other features that have a location on the surface of the earth (11). Geospatial data typically combine location information (usually coordinates on the earth), attribute information (the characteristics of the object, event or phenomena concerned), and often temporal information (the time or lifespan at which the location and attributes exist). The data may include objects represented through a single fixed location point (e.g. a health facility), objects with an aerial extent such as polygons and lines represented through a collection of location points (e.g. administrative regions or roads), and continuous features represented through a gridded mesh of values each representing a quantity for a defined spatial unit, such as a 1 × 1 km square area (e.g. terrain, land surface attributes or population distribution).
Geospatial technologies are the tools that allow the creation, management, editing, analysis, modelling, visualization and sharing of geospatial data and their attributes. The three main geospatial technologies are satellite imagery, used mostly to create spatial datasets through observation (widely used by road vehicle drivers around the globe); Global Positioning System (GPS) software, used mostly to create spatial datasets through pinpointing the location of objects; and geographic information system (GIS) software, used to manage, analyse and visualize data in many fields and sectors, including health.
Geospatial data are collected in a number of ways. They can be collected via satellite imagery, which has the advantage of providing relatively frequent global coverage of many types of information. Mobile GPS receivers can collect spatial data containing location and boundaries and the association of attribute data to specific locations (referred to as geographic data or geographic information). For example, mobile GPS can record the location of a specific household and information about the vaccination status of the children in that household, or whether that household received an insecticide-treated bed-net. Geospatial data may also be collected through environmental sensors (which provide information about air quality, water quality, noise, temperature and weather) or as part of traditional data collection activities. Geospatial data may also be collected via mobile applications and location information enabled on, for example, social media posts.
Working with geospatial data requires the application of geospatial software and the use of dedicated geospatial databases. Although the task of collecting, managing and analysing spatial data has traditionally required specialized knowledge, the increasing availability of geospatially enabled services on mobile devices and the production of custom geospatial dashboards have made these technologies more accessible to a wide range of users, especially at the stages of data collection and visualization.
Geospatial data have many applications in health (Box 16.1). A key feature of geospatial analytics is that it enables the understanding of complex spatial patterns and trends, which may otherwise be hidden (see Chapter 25). It also allows aggregation of all types of information to different geographical units, such as districts, local government areas, health facility catchment areas and other units of programmatic significance, which can aid targeted decision- and policy-making.
BOX 16.1. Applications of geospatial data in health
Surveillance, monitoring and response: mapping demographic and health data is part of monitoring disease outbreaks or other public health concerns such as natural disasters, environmental health risks or the effects of climate change. It helps to quantify effects on health, analyse spatial distributions, identify hotspots, provide early warning systems, and track changes over time and space. This information can help public health officials respond quickly and appropriately.
Optimizing health-care delivery: using maps supports health-care planning and delivery, such as analysing the distribution of health facilities in relation to the prioritized population, mapping physical accessibility to health facilities, estimating distances and travel times between health facilities and communities to identify populations with limited access to care, planning mobile and community health delivery, testing resource allocation scenarios, and optimizing the routing of emergency services.
Epidemiological studies: investigating the spatial relationship between environmental factors (e.g. air pollution, water quality and climate change) and disease burden or disease vectors can serve to strengthen understanding and prediction of disease risk factors, transmission patterns and epidemiological spatiotemporal dynamics, helping to inform prevention and control measures.
Filling data gaps: geospatial models can be used to extrapolate information measured at specific locations such as survey points to obtain estimates at unsampled locations. They can enhance availability of data on demographic characteristics (e.g. population density), socioeconomic factors (e.g. income or poverty levels) and health indicators for areas in which empirical data might not be available. For example, spatially modelled population estimates using micro-census data and geospatial covariates are used extensively to support the optimization of health service planning and resource allocation, and to provide denominators for monitoring coverage in the absence of recent census data.
Organizational coordination: geospatial data are used to map and share data across organizations to plan and deliver humanitarian assistance and emergency responses, and to coordinate efforts between the health sector and other sectors more effectively.
Health information system interoperability: the use of common and agreed geographic references in a country (e.g. authoritative information about administrative boundaries) serves as a powerful interoperability standard to enable the triangulation of data sources within and beyond the health sector.
The Demographic and Health Survey (DHS) Program Spatial Data Repository has published datasets that contain spatially modelled estimates of a The Demographic and Health Survey (DHS) Program Spatial Data Repository has published datasets that contain spatially modelled estimates of a number of DHS indicators relevant to health inequality monitoring, including health outcomes (e.g. anaemia, stunting), health access indicators (e.g. vaccination status, delivery at health facilities) and other socioeconomic factors (e.g. tobacco consumption, population using an improved water source) (12). It also contains geospatial datasets of population, climate and environmental indicators used as covariates (Box 16.2). Other geospatial data sources that are freely accessible include WorldPop for global- and country-level data on population demographics and other developmental indicators (14); LandScan for high-resolution global population data (15); the United Nations Environment Programme Global Resource Information Database (GRID-Geneva) (16) and UN-SPIDER (17) for environmental data; NASA Earth Observation Data for data based on satellite imagery (18); GRID3 data on human settlements, population and health infrastructure (19); and geodata in the Humanitarian Data Exchange platform (20).
BOX 16.2. The DHS Program geospatial covariates
DHS geospatial covariate datasets contain population, climate and environmental data at a 5 × 5 km spatial resolution collated from several publicly available sources (13). The original sources collected geospatial data via remote sensing and modelling. The datasets are referred to as covariates because they contain data that can potentially influence outcomes of interest collected in surveys, such as health status. Geospatial covariate datasets include the population of children aged under five years, population density, travel time to a high-density urban centre, nightlight (nighttime light emissions), rainfall, temperature, elevation and aridity.
Strengths and limitations of geospatial data
Geospatial data open new possibilities concerning the data that can be used for within-country inequality monitoring. This may provide more intuitive understanding of health inequalities, and support programme planning at local administrative levels (21). Visualizing data on maps or overlaying different sources and types of geospatial data can help identify patterns of inequality that are not immediately apparent when assessing disaggregated data alone. This can help pinpoint areas being left behind, concentrations of populations experiencing historical or contemporary disadvantage, or concentrations of diseases or conditions that require further public health programming. Mapping summary measures of inequality can also help to identify regions or areas with higher inequalities for a health indicator. Mapping data at smaller geographical levels can support local-level service delivery planning and decision-making, referred to as microplanning (22).
Geospatial data that incorporate individual-level information such as location of residence, treatment outcomes and mortality can enhance understanding of health inequalities and enhances the precision of health interventions. Maps can be used to track population risk factors at granular levels, such as the spatial distribution of the Plasmodium falciparum parasite that causes malaria (23); to inform public health measures, such as using population and building density to calculate an index of physical distancing during the COVID-19 pandemic (Figure 16.1); and to identify concentrations of populations experiencing vulnerability to support the planning of health interventions such as routine immunization among, for example, nomadic groups (Figure 16.2).
FIGURE 16.1. Using maps to inform COVID-19 control measures in Nairobi, Kenya
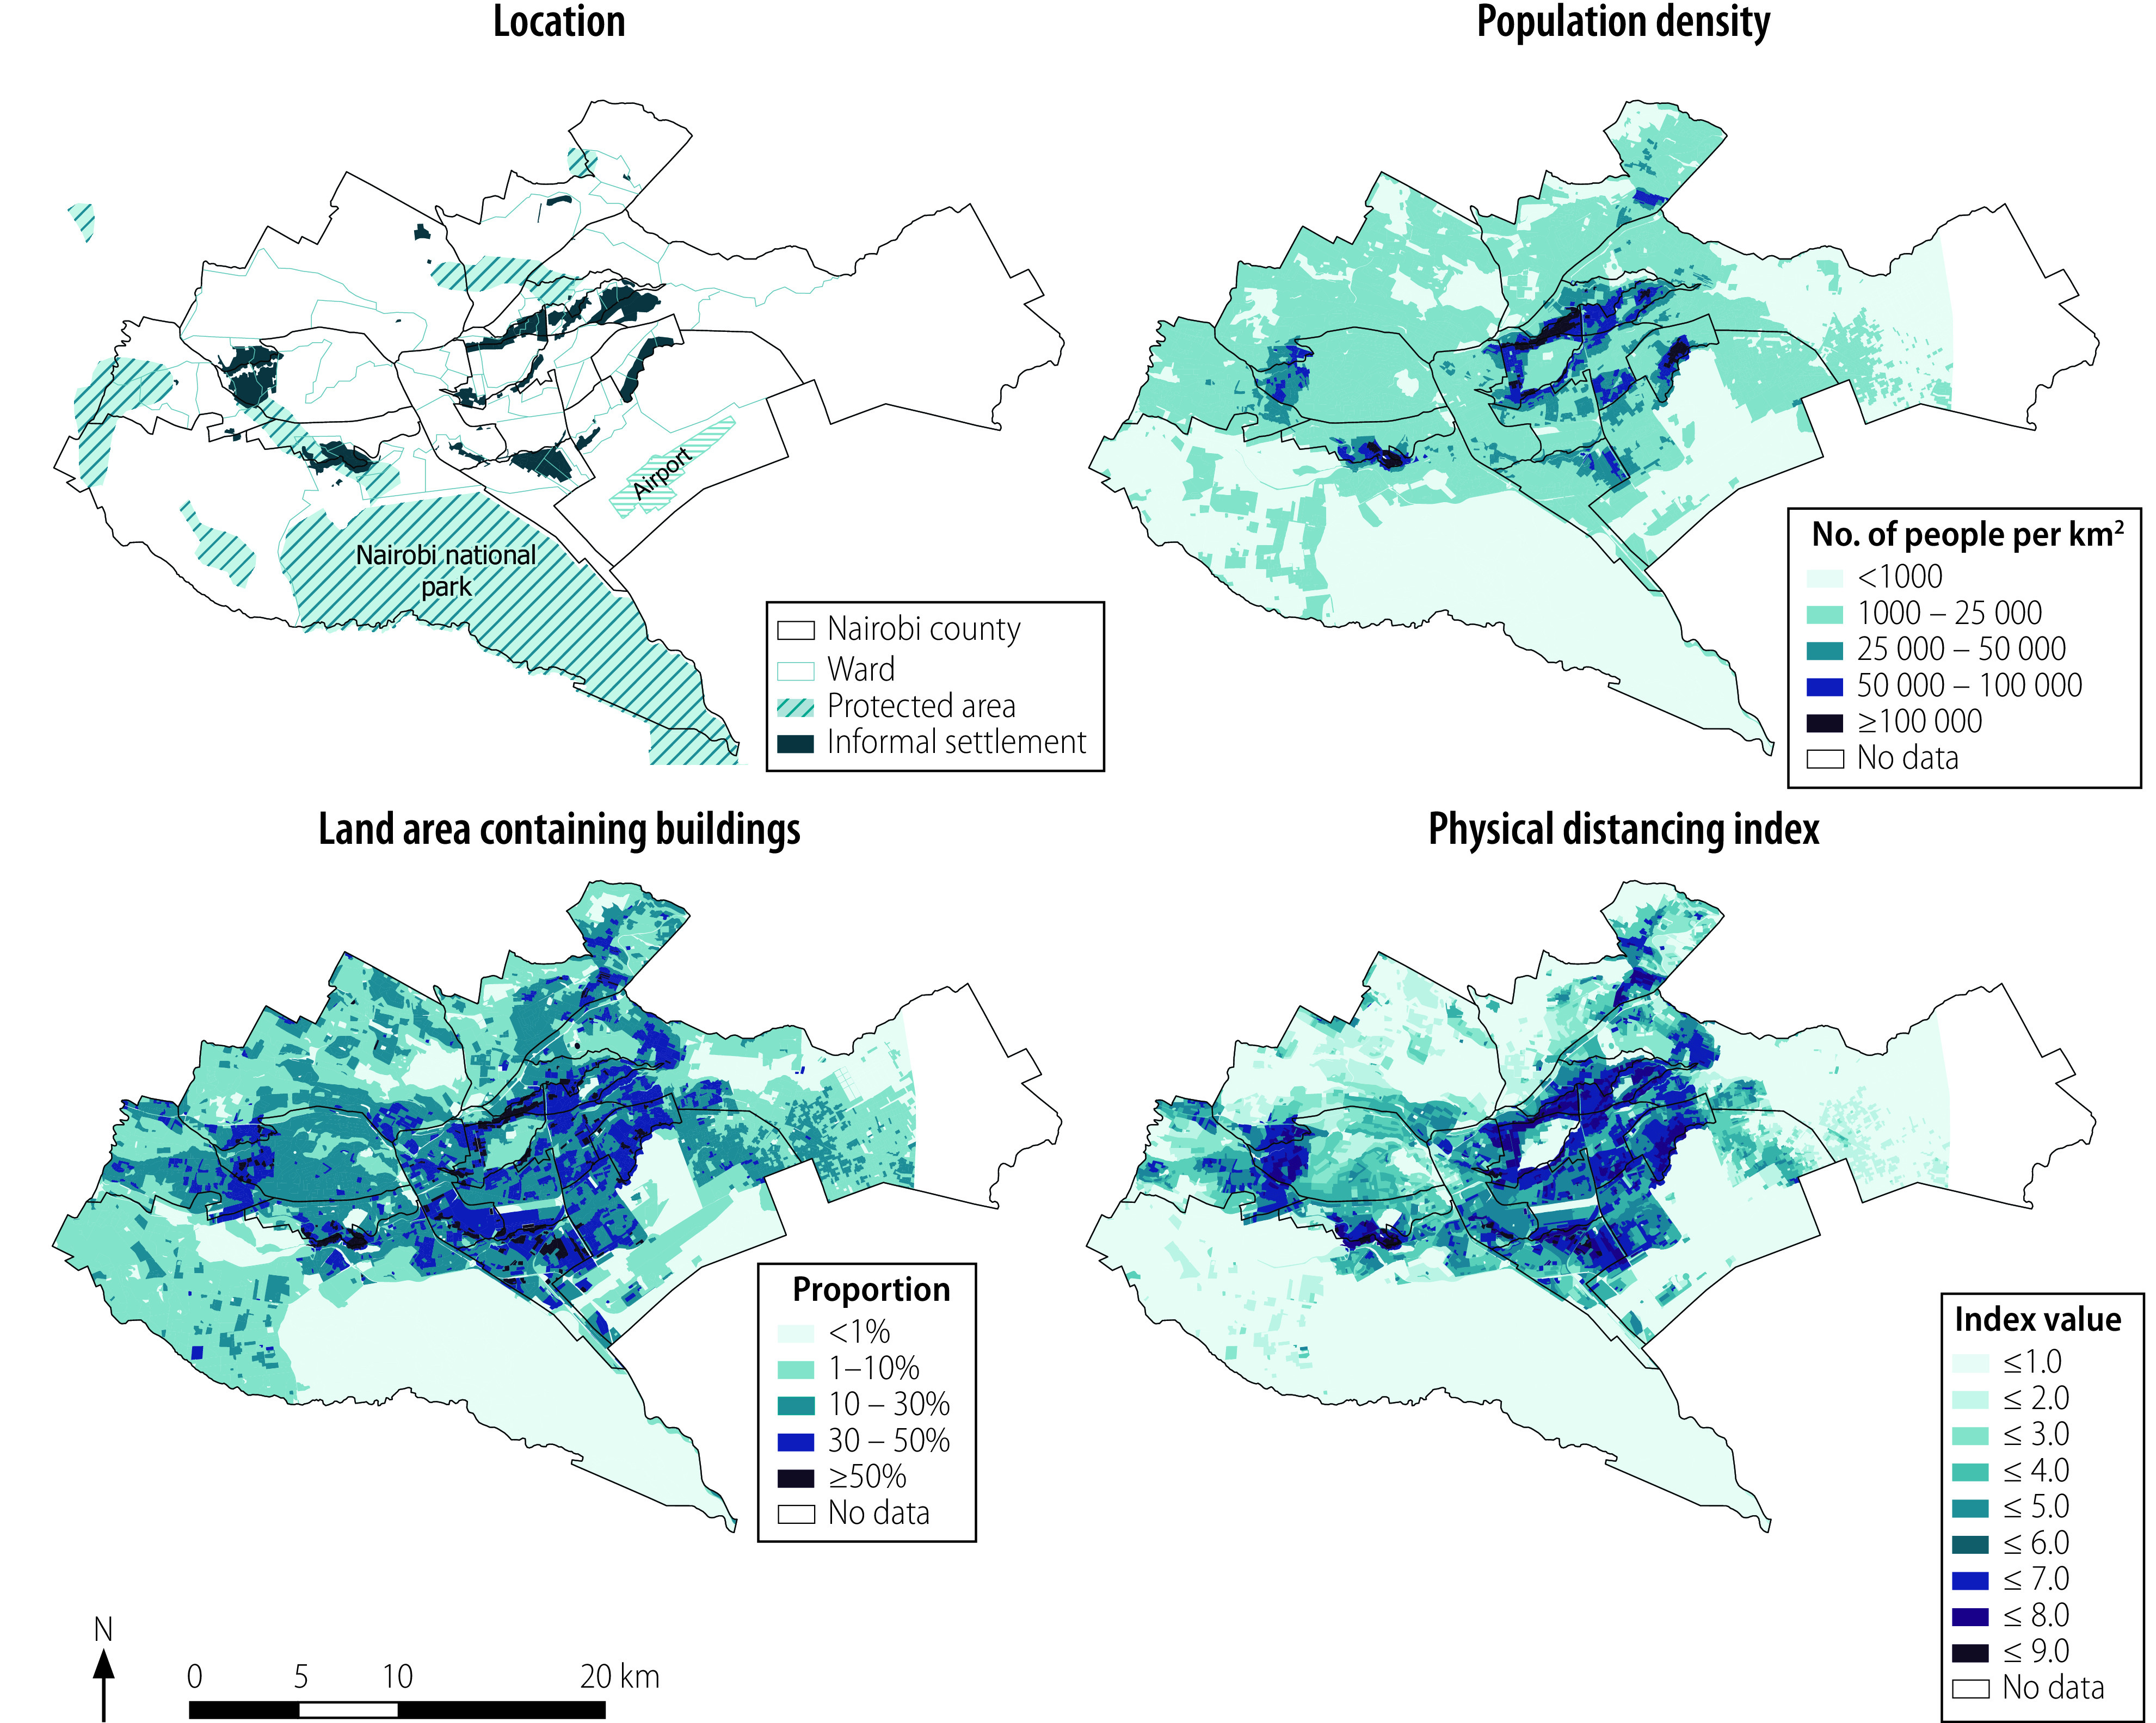
These maps were not produced by WHO. The designations employed and the representation of countries and areas in these maps may be at variance with those used by WHO and do not imply the expression of any opinion whatsoever on the part of WHO concerning the legal status of any country, territory, city or area or of its authorities, or concerning the delimitation of its frontiers or boundaries.
Source: Chamberlain, Macharia and Tatem (24), with data from May 2022.
FIGURE 16.2. Mapping locations of nomadic groups across Cameroon, Central African Republic, Chad, Niger and Nigeria
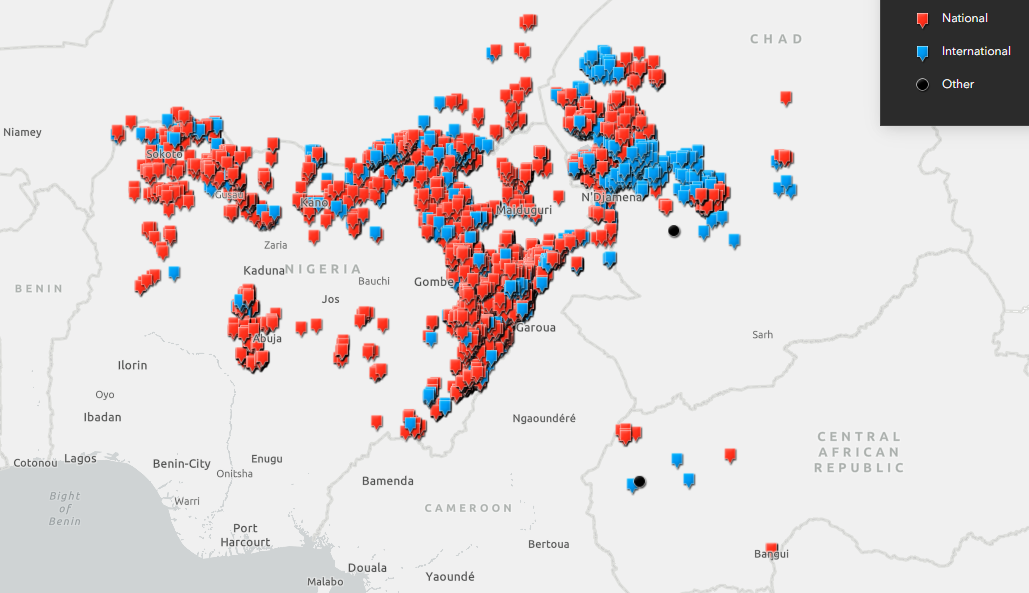
This map was not produced by WHO. The designations employed and the representation of countries and areas in this map may be at variance with those used by WHO and do not imply the expression of any opinion whatsoever on the part of WHO concerning the legal status of any country, territory, city or area or of its authorities, or concerning the delimitation of its frontiers or boundaries.
Source: Geospatial Research, Analysis and Services Program and WHO Regional Office for Africa GIS Centre (25), with data from 2021.
Many household surveys have started routinely collecting the geographical location of surveyed clusters or households, including DHS, Multiple Indicator Cluster Surveys (MICS; for surveys in the MICS 7 round and later) and Living Standard Measurement Study (LSMS). This practice enables types of analysis that are not possible with traditional data sources, such as model-based geostatistics, ecological correlation, distance, proximity and cluster analysis, which can bring new insights to inequalities (see Chapter 25).
In addition, by overlaying or comparing health data with demographic, socioeconomic and environmental information at subnational levels, geospatial analysis can reveal patterns related to dimensions of inequality that may be unavailable in other data sources. For example, linking geospatial data used to model poverty rates at small subnational levels with health data can identify how health differs across populations with different rates of poverty. In the absence of income data, nightlight satellite imagery has been used as a proxy for measuring economic status because it captures wealth, consumption, and spending on investment and infrastructure (26). At the same time, nightlight can also reflect areas of higher light, noise pollution and social vulnerability (27) (see Box 16.3). Geospatial data collected using cameras, however, are limited to the field of view of the camera and may not capture hidden characteristics of groups that are not visible, such as migrant status or health status. Geospatial data on other environmental factors such as air quality, elevation and aridity can be used to understand inequalities related to the type of environments in which people live.
BOX 16.3. Nightlight satellite imagery and social disadvantage in Chicago, United States of America
Figure 16.3 shows two maps of the city of Chicago. The left map depicts nightlight, with lighter colours indicating higher levels of light. The right map depicts levels of social disadvantage, with darker colours indicating higher levels of vulnerability. The images show a rough correlation between higher nightlight exposure and social disadvantage, revealing complex interactions between the environment and socioeconomic conditions (28).
FIGURE 16.3. Using maps to show light exposure at night and level of social disadvantage, by census tract in the greater Chicago area, United States of America
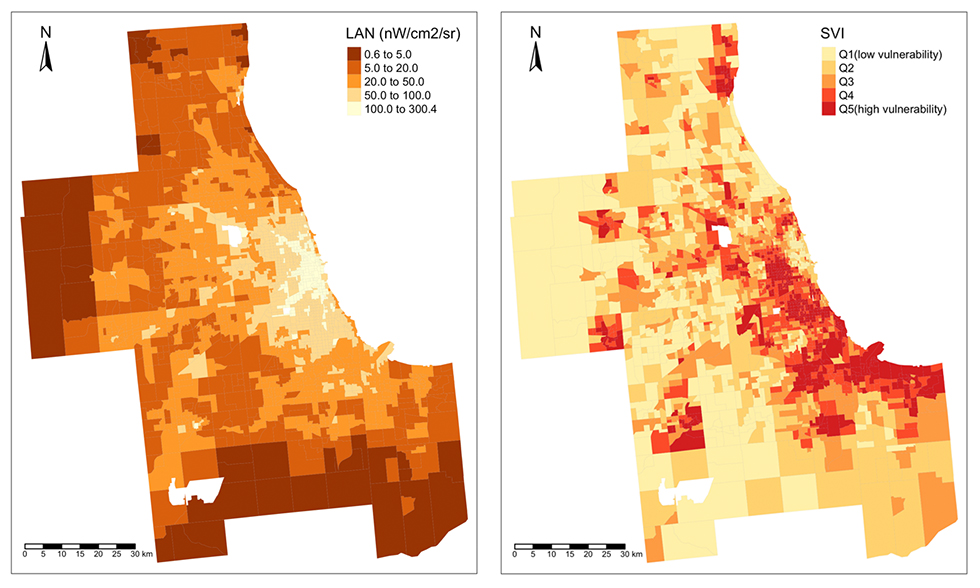
LAN, light exposure at night levels; SVI, social vulnerability index. LAN is measured in nanowatts per centimetre squared per steradian (nW/cm2/sr).
These maps were not produced by WHO. The designations employed and the representation of countries and areas in these maps may be at variance with those used by WHO and do not imply the expression of any opinion whatsoever on the part of WHO concerning the legal status of any country, territory, city or area or of its authorities, or concerning the delimitation of its frontiers or boundaries.
Source: NASA Earthdata (28), with data from 2020.
Although much progress has been made to increase the availability and accessibility of geospatial data, particularly through open data policies and regulations, remaining challenges to geospatial data openness include intellectual property restrictions, privacy and security concerns when highly granular geospatial information is collected and shared, confidentiality, standardization and interoperability (29). Sustainable and cost-effective use of geospatial data for inequality monitoring and decision-making requires investment in strengthening geospatial data management technical capacity human resources (22). A framework of policies, strategies and national commitment is required to incorporate geospatial data and technologies into the health information system.
Geospatial data quality relies on guidelines, standards and protocols for the management and recording of data. Data collected with insufficient accuracy and adherence to agreed standards can lead to errors, with an impact on decision-making. For example, if geospatial data about the transportation network are not up to date, then distance analysis will be inaccurate. To manage this, national spatial data infrastructures that aim to facilitate the production, standardization and sharing of geospatial data, including the development of open data geospatial catalogues, are becoming increasingly common in countries. These are backed by international standards for geographic information metadata (30).
Geospatial data present concerns for confidentiality and geoprivacy (e.g. individual rights to prevent disclosure of the location of their home, workplace, daily activities or trips), necessitating measures to ensure privacy during the sharing, use and analysis of geospatial data. This is achieved, for example, through anonymization, data aggregation or introduction of randomized shift in geospatial coordinates (as practised in DHS clusters) (31). Countries may exhibit differences in the availability and application of governance mechanisms. Potential or existing legal and policy considerations on sharing these data with law enforcement or other security bodies must also be taken into account.
Mobile and web-based surveys
Mobile surveys gather responses from participants using mobile devices through mobile networks. Mobile surveys include Short Message Service surveys, in which text messages are used to collect data from participants; interactive voice response surveys that contact respondents through voice calls but rely on prerecorded questions instead of live interviewers; and computer-assisted telephone interviews, in which interviewers call respondents to collect data. Web-based surveys are completed over the internet, with participants providing responses via an online method, such as a link from an internet advertisement, a mass email or a special application preinstalled on a device. A special type of web-based surveys is the recruitment and administration of questionnaires to users of social media platforms, such as Facebook and X (formerly Twitter). Examples of mobile and web-based surveys are provided in Box 16.4.
BOX 16.4. Examples of mobile and web-based surveys
The following are examples of prominent multicountry mobile and web-based surveys, including those administered via social media platforms, across various topics and settings. This list is not exhaustive. More information about each survey is available online.
Mobile surveys:
The World Health Survey Plus, which collects data to monitor progress towards population health targets and health-related Sustainable Development Goals, includes both web-based and mobile phone surveys (32).
The Partnership for Evidence-Based Response to COVID-19 survey collects economic, epidemiological, population movement and security data via phone surveys across 19 African countries (33).
COVID-19 mobile phone surveys conducted by the United States Centers for Disease Control and Prevention in Ecuador and Sri Lanka provides decision-makers with swift information about knowledge, practices, symptoms, conditions and testing availability (34).
The Rapid Mobile Phone Survey is a surveillance tool of the WHO Regional Office for the Americas to quickly assess noncommunicable disease policies and interventions (35).
The Rapid Mortality Mobile Phone Surveys project is a multicountry study that began in December 2020 with the aim to develop and validate methods for timely (excess) mortality estimation in low- and lower-middle-income countries (36).
LSMS high-frequency telephone surveys are carried out by the World Bank in Burkina Faso, Ethiopia, Malawi, Nigeria, Uganda and the United Republic of Tanzania (37).
Web-based surveys:
The International Sexual Health and Reproductive Health study provides data about sexual and reproductive health in selected countries during the COVID-19 pandemic with collection via an online survey link disseminated through local, regional and national networks (38).
The Health Information National Trends Survey regularly collects nationally representative data in the United States of America about knowledge of, attitudes towards and use of cancer- and health-related information (39).
The University of Maryland COVID-19 Trends and Impact Survey, in partnership with Facebook, provides data related to COVID-19 symptoms, knowledge, behaviours and testing on a daily basis from Facebook users in 114 countries (with survey weights) between May 2020 and June 2022 (40).
The Climate Change Opinion Survey sampled more than 100 000 Facebook users from nearly 200 countries and territories, asking respondents about their knowledge of and attitudes and behaviour towards climate change issues (41).
The Survey on Gender Equality at Home is a research collaboration between Equal Measures 2030, Facebook, Ladysmith, UN Women and the World Bank. The survey was conducted in July 2020 to capture household gender dynamics during the COVID-19 pandemic (42).
Like traditional surveys, probability-based sampling techniques may be used in collecting data from a sample of the prioritized population (see Chapter 12). Respondents can be selected at random via a digit dialling approach, from a list of valid mobile telephone numbers provided by a mobile network or telecom operator, or from a list of numbers obtained from a previous household survey or health programme. Many web-based surveys are non-probabilistic surveys, where the probability of a population member being included in the sample is unknown. In these cases, respondents may be recruited by following a link or banner to a survey placed on a webpage (referred to as river sampling or opt-in panels) or invited via a mailing list or social media advert. The sampling technique used has implications on data analysis methods and the validity of results. The composition of respondents in the sample is usually compared with sociodemographic information from other data sources (such as a census or representative baseline survey) to set or adjust the relative weights of respondents (43).
Strengths and limitations of data from mobile and web-based surveys
Mobile and web-based surveys have several advantages for health inequality monitoring compared with traditional household surveys. They allow researchers to reach a large number of potential respondents from diverse populations, from specific prioritized demographic groups, from locations that are dangerous or remote, and from locations with very limited access to health services. Surveys administered via these channels can be cost-effective because they can be delivered rapidly and do not require travel or human resources for face-to-face interviews, and therefore they can provide timely and rapid data for inequality monitoring. Data quality can also be improved through the use of real-time data quality checks, prefilled answers based on respondent online profiles, and validation of respondents’ locations.
Traditional household health surveys typically are only representative at national or first administrative levels, and therefore disaggregated estimates at subnational levels are often less reliable. In contrast, the increase in mobile telephone ownership and internet connectivity has enabled collection of data from larger sample sizes, which can increase the precision of disaggregated indicator estimates. Moreover, repeated mobile and web-based surveys can deliver trend data over time, enabling more nuanced analyses than cross-sectional analyses and the evaluation of public health interventions in a timely manner. For example, the COVID-19 Trends and Impact Survey collected data in 114 countries on a daily basis, supporting real-time understanding of how COVID-19-related symptoms, behaviours and testing varied across population groups and settings, informing relevant decision-making (40, 44).
These survey modes can be used to collect inequality data in situations where face-to-face interviews are challenging or impossible. They are particularly suitable during health emergencies, where there is a great need for health data for decision-making but personnel movement is restricted or there are safety concerns for personnel. For example, the use of mobile and web-based surveys was demonstrated in the 2014 Ebola outbreak in western Africa; in the 2017 drought- and conflict-related food insecurity crisis in Nigeria, Somalia, South Sudan and Yemen; and during the 2020–2022 COVID-19 pandemic (45-47). High-frequency data collection allows the addition of new or updated questions in response to policy inquiries during an evolving crisis. Moreover, for populations such as refugees and migrants, mobile and web-based surveys are increasingly common for collecting data, opening more opportunities for inequality monitoring (48). For more on inequality monitoring in emergency contexts and among refugee and migrant populations, see Chapter 5.
Mobile and web-based surveys carry some limitations. Although mobile telephone and internet penetration continues to grow globally, its coverage remains low in certain areas and for some populations, causing sampling biases in mobile and web-based surveys. This is especially true in lower-income countries (49). Variation in literacy, computer literacy, language and willingness to participate in surveys can also cause bias. This has implications for monitoring inequalities, because certain subgroups (such as those that are remote, older, or experiencing vulnerability or poverty) tend to have lower mobile telephone and internet access and use and thus are underrepresented; disaggregated estimates for these groups may not be reliable. Although mobile and web-based surveys commonly ask for demographic information from respondents, it may be difficult to link the survey sample to a national population and establish sampling weights that counteract this bias when the demographic distribution of the users of a telephone or internet service is not known (43). Biases may also be caused by self-selection, which occurs when the respondents who decide to participate in a survey differ systematically from the people who do not participate. Biases may also be due to attrition, which occurs when respondents who drop out of the survey differ from respondents who complete the full survey. Such bias exists in all types of surveys, but it is less an issue for traditional household surveys where interviewers are present.
Caution must be exercised when using data from mobile and web-based surveys for inequality monitoring purposes, recognizing the potential gaps in representation and consequential biases. Integrating data from various sources is essential to mitigate these limitations and foster a more comprehensive understanding of health inequalities.
Health tracking applications
Health tracking applications use mobile devices such as smartphones, wearable devices, medical devices equipped with Wi-Fi (also referred to as the Internet of Medical Things) and other wireless devices to collect or generate health and health-related data. This data collection method has been supported by the rapid increase in smartphones and internet access globally. Health monitoring via mobile technologies is an element of mobile health (mHealth), defined as the use of mobile devices for medical and public health practice. (Note, however, that mHealth also expands to the use of mobile devices for communication between individuals and health services, consultation between health professionals, and access to health information (50).) It is also linked to personal or personalized health (pHealth), where data are owned, managed and self-monitored by the individual and can provide a horizontal and holistic view of that person’s health, including health behaviours, risk factors and lifestyle (51).
Health tracking applications can be classified as passive or active. Passive applications generate or derive health data using sensors, whereas active applications rely on manual user input (52). Wearable devices are passive data collection tools that can be used for continuous and real-time health monitoring, such as related to physical activity, sleep, and heart and respiration rates. Some devices are used in clinical settings to monitor people with chronic disease or health risks (e.g. pulse oximeters that detect oxygen levels, blood glucose monitors, and data gloves that monitor hand mobility in people with neurological conditions). Others are nonclinical, used by the general population to collect personalized data about their own life and well-being (e.g. smartwatches and smart rings that collect general data about activity, heart rate, stress levels and sleep). The data collected are usually made available via a software application for self-monitoring or for monitoring by a health professional. COVID-19 proximity tracking and contact tracing apps, which passively record proximity of the user to other app users within a prespecified radius for a certain amount of time, are another example of passive health tracking applications. Health apps that require the manual entry of information such as diet, weight, physical activity, medication and mental health are examples of active data collection tools.
Strengths and limitations of data collected via health tracking applications
When health data collected by tracking applications are linked to other personal data, such as age, location or sex, or linked to other datasets containing information related to the individual’s place of residence, it opens possibilities for health inequality monitoring. Linking health data to a person’s location can reveal insights about environmental and social influences on health. It facilitates analysis of how certain health behaviours, health risk factors or responses to public health interventions may differ across population groups (53). Data linking requires common identifiers, such as personal identity numbers or postal codes (see Chapter 15).
An advantage for health inequality monitoring is that tracking applications offer real-time data collection, large samples and higher precision, allowing for continuous monitoring of health metrics and broad outreach across population groups. Health tracking applications can also support the monitoring of inequalities in health indicators that are difficult to monitor via other data collection methods. For example, data collected via applications for mood tracking and stress management can augment understandings of how mental health differs across population groups. Wearable devices can also be used by people in remote settings where access is difficult or when a person cannot travel to a clinic or hospital because of their illness or disability, therefore supporting inequality monitoring of certain groups experiencing disadvantaged or vulnerability.
Compared with household surveys that sometimes collect biodata samples (e.g. blood pressure, blood sugar, height, weight), wearable devices are a low-cost and efficient way of collecting large quantities of health data, which supports more reliable disaggregated estimates. They also remove recall bias and incorrect self-judgements about health levels that may be encountered with surveys. Moreover, they are more likely to provide an accurate and representative measure of an individual’s physical status than a snapshot of data collected during a routine hospital appointment or household survey. Therefore, this has the potential to increase data quality for inequality monitoring.
The digital divide in access to and use of mobile technologies, discussed above in Ethical considerations for data use and access, can affect the completeness and representativeness of the health data collected via health tracking applications. Health literacy and health-consciousness are prerequisites to using and understanding health tracking devices, particularly those that are nonclinical, because this requires an understanding of the links between health behaviours and health outcomes, ability to obtain information over the internet, and interest in self-monitoring health. Access to and use of health tracking devices, including expensive medical devices, may be more common among more affluent people. Additionally, cultural and linguistic diversity can pose challenges in designing inclusive digital health tools that cater to diverse populations. This means that data for certain population groups of interest may be lacking or unreliable for inequality monitoring.
Privacy and data protection must be considered within the context of health tracking technology. The digital tracking of individuals’ health status may be controversial in some circumstances, such as among migrants or other groups who lack legal status in particular settings. Data collected via wearable devices are often commercially owned – individuals need to provide informed consent for use of their data, and access to these data by organizations may require specific data-sharing agreements and processes before they can be used for inequality monitoring purposes. The quality of health applications is also a consideration – an app should be proven to be accurate, useful, usable and used in order to be assessed as a high-quality data source for inequality monitoring. Medical app accreditation programmes, in which apps are subject to formal assessment or peer review, are a recent development that aims to provide clinical assurances about quality and safety of applications.
Digital public health surveillance
Public health surveillance is the continuous collection, analysis and interpretation of health-related data, aimed at detecting disease and implementing control measures (see Chapter 14). DPHS uses information from social media, news media, discussion forums, internet search engines and other web-based sources to detect disease and facilitate public health responses (54).
These digital sources can be used for infoveillance and infodemiology (55). Infoveillance, a type of event-based surveillance, pulls data from various online sources to identify emerging health threats and at-risk populations, with the primary aim of surveillance. Infodemiology is the study of the determinants and distribution of health information and misinformation (56), with the aim of informing public health policies and actions. These are both based on the idea that there is a relationship between population health on the one hand, and information and communication patterns in electronic media on the other hand. Changes in information and communication patterns on the internet can be an early sign of changes in population health. Conversely, changes in information and communication patterns – such as misinformation or a public health campaign – could also have a negative or positive impact on population health.
There are various methods of extracting public health information from online sources. Keyword searches or natural language processing (computer programs that process text or speech) can be used to identify content on specific health topics. Data from search engines can provide information about the number of searches pertaining to a specific topic from a specific region. Social media posts can also be used to track evolving situations during outbreaks. Crowdsourced data over the internet represent an example of participatory surveillance, whereby information or opinions are gathered from people in real time. Owing to the volume and types of data in digital sources, DPHS often uses machine learning algorithms (mathematical models used to learn or uncover underlying patterns embedded in data). Some examples of DPHS are provided in Box 16.5.
BOX 16.5. Examples of digital public health surveillance
The following examples of DPHS span different topics and settings. This list is not exhaustive. More information about each data collection is available online.
SENTINEL processes data from X (formerly Twitter) to identify self-reports of illness and predict disease occurrence and potential outbreaks (57).
InfluenzaNet (in Europe) and Outbreaks Near Me (in Canada, Mexico and the United States) are online participatory surveillance systems for influenza based on self-reported symptoms volunteered by participants (58, 59).
HealthMap brings together different online data sources, including online news, eyewitness reports, expert-curated discussions and official reports through an automated process to achieve a comprehensive view of the current global state of infectious diseases (60).
Google Trends is a free open-source tool used to track and observe internet search activity. It has been used, for example, for surveillance of COVID-19 and influenza, and for plague outbreaks in Madagascar (61).
Strengths and limitations of digital public health surveillance
Although standard surveillance systems can provide data for certain health indicators, corresponding information on dimensions of inequality may be more limited (see Chapter 14). DPHS can provide increased opportunities for inequality monitoring due to the flexibility of real-time and rapid data collection across large groups of the population and even globally. Trends in specific population groups and dimensions of inequality can be monitored, because DPHS can capture information related to groups experiencing disadvantage who do not come into contact with more traditional medical-based surveillance systems. It also offers possibilities for surveillance in low-resource settings, when infrastructure, capacity and resources for traditional surveillance systems are limited. DPHS also has applications in crisis settings, when rapid and real-time information is important. Moreover, it opens the possibility of monitoring inequality in topics such as misinformation.
Given that complicated biases exist in internet and social media data, digital data are often best used to supplement rather than replace traditional public health surveillance data sources for health inequality monitoring. DPHS can suffer from problems of accuracy due to sample bias and overinterpretation of findings (i.e. seeing differences or trends where none exist).
The digital divide affects the representativeness of DPHS data, creating sample bias. This may be addressed to some extent through weighting to adjust samples to be representative of populations, but ascertaining demographics can be challenging. Interpreting data from DPHS to make assessments about inequalities is often a difficult task, and there is a risk of poor or incomplete data, leading to weak or misleading conclusions. The data collected via DPHS efforts often capture public awareness or indirect measures of disease (62). Trending topics in social media can be self-perpetuating due to social media algorithms and can be influenced by media attention or confounded due to other events happening at the same time. Moreover, when online content changes frequently, the assumptions made when algorithms were developed may no longer hold true. This can lead to the diminished accuracy of conclusions drawn from DPHS over time if algorithms are not updated. For example, Google Flu Trends, a program built to predict influenza based on people’s web searches, was discontinued after it failed to accurately predict prevalence. This yielded important lessons for DPHS regarding the need for accurate and continually updated algorithms (63).
DPHS requires specialized technological capacity and skills, which may limit its use for inequality monitoring in certain contexts. For DPHS systems to be cost-efficient, they require automated programs to manage and analyse the data, potentially large start-up costs, and regular upkeep to maintain the accuracy of algorithms. Moreover, digital data are not owned by the public – the data are collected by private companies, and therefore continued access is a requirement for conducting DPHS.
References
1. Harnessing artificial intelligence for health. Geneva: World Health Organization (https://www.who.int/teams/digital-health-and-innovation/harnessing-artificial-intelligence-for-health, accessed 31 May 2024).
2. Global strategy on digital health 2020–2025. Geneva: World Health Organization; 2021 (https://iris.who.int/handle/10665/344249, accessed 6 June 2024).
3. Abernethy A, Adams L, Barrett M, Bechtel C, Brennan P, Butte A, et al. The promise of digital health: then, now, and the future. NAM Perspect. 2022;2022:10.31478/202206e. doi:10.31478/202206e.
4. Regional digital health action plan for the WHO European Region 2023–2030. Tel Aviv: World Health Organization; 2022 (https://iris.who.int/handle/10665/360950, accessed 6 June 2024).
5. Seventy-first World Health Assembly. Geneva: World Health Organization; 2018 (https://iris.who.int/handle/10665/326571, accessed 6 June 2024).
6. Yao R, Zhang W, Evans R, Cao G, Rui T, Shen L. Inequities in health care services caused by the adoption of digital health technologies: scoping review. J Med Internet Res. 2022;24(3):e34144. doi:10.2196/34144.
7. Equity within digital health technology within the WHO European Region: a scoping review. Copenhagen: World Health Organization; 2022 (https://iris.who.int/handle/10665/365326, accessed 6 June 2024).
8. WHO guideline: recommendations on digital interventions for health system strengthening. Geneva: World Health Organization; 2019 (https://iris.who.int/handle/10665/311941, accessed 6 June 2024).
9. Classification of digital interventions, services and applications in health. Geneva: World Health Organization; 2023 (https://iris.who.int/handle/10665/373581, accessed 6 June 2024).
10. Suver C, Kuwana E. mHealth wearables and smartphone health tracking apps: a changing privacy landscape. Inf Serv Use. 2021;41(1–2):71–79. doi:10.3233/ISU-210114.
11. Stock K, Guesgen H. Geospatial reasoning with open data. Autom Open Source Intell. 2016;171–204. doi:10.1016/b978-0-12-802916-9.00010-5.
12. Demographic and Health Surveys Program. The DHS Program Spatial Data Repository. Rockville, MD: United States Agency for International Development (https://spatialdata.dhsprogram.com/home/, accessed 17 June 2024).
13. Dontamsetti T, Assaf S, Yourkavitch J, Mayala B. A primer on the Demographic and Health Surveys program spatial covariate data and their applications. DHS Spatial Analysis Reports 16. Washington, DC: United States Agency for International Development; 2018 (https://www.dhsprogram.com/pubs/pdf/SAR16/SAR16.pdf, accessed 6 June 2024).
14. Open spatial demographic data and research. Southampton, United Kingdom: World Pop (https://www.worldpop.org/, accessed 17 June 2024).
15. LandScan Global. Oak Ridge, TN: Oak Ridge National Laboratory (https://landscan.ornl.gov/, accessed 24 June 2024).
16. Data platform. Geneva: United Nations Environment Programme (https://unepgrid.ch/en/platforms, accessed 22 June 2024).
17. Databases and compilations of geospatial data. Vienna: United Nations Platform for Space-based Information for Disaster Management and Emergency Response (https://un-spider.org/links-and-resources/data-sources/data, accessed 17 June 2024).
18. Earthdata. Washington, DC: National Aeronautics and Space Administration Earthdata (https://www.earthdata.nasa.gov/, accessed 22 June 2024).
19. Grid3 data hub. New York: Columbia University (https://data.grid3.org/, accessed 22 June 2024).
20. The Humanitarian Data Exchange. Geneva: United Nations Office for the Coordination of Humanitarian Affairs (https://data.humdata.org/, accessed 22 June 2024).
21. Hosseinpoor AR, Bergen N. Area-based units of analysis for strengthening health inequality monitoring. Bull World Health Organ. 2016;94(11):856–858. doi:10.2471/BLT.15.165266.
22. Chaney SC, Mechael PN. Improving immunisation coverage and equity through the effective use of geospatial technologies and data. Cape Town: Healthenabled; 2020 (https://www.gavi.org/sites/default/files/document/2020/GIS-and-Immunisation-Landscape_EN.pdf, accessed 22 June 2024).
23. Weiss DJ, Lucas TCD, Nguyen M, Nandi AK, Bisanzio D, Battle KE, et al. Mapping the global prevalence, incidence, and mortality of Plasmodium falciparum, 2000–17: a spatial and temporal modelling study. Lancet. 2019;394(10195):322–331. doi:10.1016/S0140-6736(19)31097-9.
24. Chamberlain HR, Macharia PM, Tatem AJ. Mapping urban physical distancing constraints, sub-Saharan Africa: a case study from Kenya. Bull World Health Organ. 2022;100(9):562. doi:10.2471/BLT.21.287572.
25. AFRO GIS: reaching all populations. Geneva: World Health Organization GIS Centre for Health; 2021 (https://storymaps.arcgis.com/stories/3a26d81380234693a8ed2c0c38342ac5, accessed 31 May 2024).
26. Galimberti JK, Pichler S, Pleninger R. Measuring inequality using geospatial data. World Bank Econ Rev. 2023;37(4):549–569. doi:10.1093/wber/lhad026.
27. Xiao Q, Lyu Y, Zhou M, Lu J, Zhang K, Wang J, et al. Artificial light at night and social vulnerability: an environmental justice analysis in the U.S. 2012–2019. Environ Int. 2023;178:108096. doi:10.1016/j.envint.2023.108096.
28. Using satellite data to solve real-world health and air quality issues. Washington, DC: National Aeronautics and Space Administration Earthdata; 2023 (https://www.earthdata.nasa.gov/learn/articles/haqast-overview, accessed 7 June 2024).
29. Sieber R. Geospatial. In: Davies T, Walker S, Rubinstein M, Perini F, editors. The state of open data: histories and horizons. Cape Town and Ottawa: African Minds and International Development Research Centre; 2019 (https://idrc-crdi.ca/en/book/state-open-data-histories-and-horizons, accessed 7 June 2024).
30. ISO 19115-1:2014: geographic information – metadata. Geneva: International Organization for Standardization; 2014 (https://www.iso.org/standard/53798.html, accessed 31 May 2024).
31. Richardson D. Dealing with geoprivacy and confidential geospatial data. ArcNews; 2019 (https://www.esri.com/about/newsroom/arcnews/dealing-with-geoprivacy-and-confidential-geospatial-data/, accessed 31 May 2024).
32. World Health Survey Plus. Geneva: World Health Organization (https://www.who.int/data/data-collection-tools/world-health-survey-plus, accessed 22 June 2024).
33. Partnership for Evidence-based Response to COVID-19 (https://preventepidemics.org/covid19/perc/, accessed 22 June 2024).
34. Phadnis R, Wickramasinghe C, Zevallos JC, Davlin S, Kumarapeli V, Lea V, et al. Leveraging mobile phone surveys during the COVID-19 pandemic in Ecuador and Sri Lanka: methods, timeline and findings. PLoS One. 2021;16(4):e0250171. doi:10.1371/journal.pone.0250171.
35. Rapid Mobile Phone Survey (RaMPS): PAHO initiative to strengthen noncommunicable disease (NCD) surveillance. Washington, DC: Pan American Health Organization (https://www.paho.org/en/enlace/ramps-rapid-mobile-phone-survey-overview, accessed 22 June 2024).
36. Rapid Mortality Mobile Phone Surveys (RaMMPS). London: London School of Hygiene & Tropical Medicine (https://www.lshtm.ac.uk/research/centres-projects-groups/rapid-mortality-mobile-phone-survey, accessed 22 June 2024).
37. World Bank Living Standards Measurement Study high-frequency phone surveys. Washington, DC: World Bank (https://www.worldbank.org/en/programs/lsms/brief/lsms-launches-high-frequency-phone-surveys, accessed 22 June 2024).
38. Michielsen K, Larrson EC, Kågesten A, Erausquin JT, Griffin S, Van de Velde S, et al. International Sexual Health And REproductive health (I-SHARE) survey during COVID-19: study protocol for online national surveys and global comparative analyses. Sex Transm Infect. 2021;97(2):88–92. doi:10.1136/sextrans-2020-054664.
39. What is HINTS? Bethesda, MD: National Cancer Institute (https://hints.cancer.gov/, accessed 22 June 2024).
40. The University of Maryland Social Data Science Center Global COVID-19 Trends and Impact Survey in partnership with Facebook. College Park, MD: University of Maryland (https://covidmap.umd.edu/, accessed 22 June 2024).
41. Data for Good. Climate change opinion survey. Menlo Park, CA: Meta (https://dataforgood.facebook.com/dfg/tools/climate-change-opinion-survey, accessed 22 June 2024).
42. Data for Good. Survey on gender equality at home. Menlo Park, CA: Meta (https://dataforgood.facebook.com/dfg/tools/survey-on-gender-equality-at-home, accessed 22 June 2024).
43. Lehdonvirta V, Oksanen A, Räsänen P, Blank G. Social media, web, and panel surveys: using non-probability samples in social and policy research. Policy Internet. 2021;13(1):134–155. doi:10.1002/poi3.238.
44. Astley CM, Tuli G, Mc Cord KA, Cohn EL, Rader B, Varrelman TJ, et al. Global monitoring of the impact of the COVID-19 pandemic through online surveys sampled from the Facebook user base. Proc Natl Acad Sci U S A. 2021;118(51):e2111455118. doi:10.1073/pnas.2111455118.
45. Pape U. Rapid emergency response survey. In: Hoogeveen J, Pape U, editors. Data collection in fragile states: innovations from Africa and beyond. Cham: Palgrave Macmillan; 2020:33–50 (https://link.springer.com/book/10.1007/978-3-030-25120-8, accessed 7 June 2024).
46. Etang A, Himelein K. Monitoring the Ebola crisis using mobile phone surveys. In: Hoogeveen J, Pape U, editors. Data collection in fragile states: innovations from Africa and beyond. Cham: Palgrave Macmillan; 2020:15–31 (https://link.springer.com/book/10.1007/978-3-030-25120-8, accessed 7 June 2024).
47. Zezza A, Martuscelli A, Wollburg P, Gourlay S, Kilic T. Viewpoint: high-frequency phone surveys on COVID-19 – good practices, open questions. Food Policy. 2021;105:102153. doi:10.1016/j.foodpol.2021.102153.
48. Tyldum G, Johnston LG. Applying respondent driven sampling to migrant populations: lessons from the field. London: Palgrave Pivot; 2014.
49. Blake A, Hazel A, Jakurama J, Matundu J, Bharti N. Disparities in mobile phone ownership reflect inequities in access to healthcare. PLOS Digit Health. 2023;2(7):e0000270. doi:10.1371/journal.pdig.0000270.
50. mHealth: new horizons for health through mobile technologies – second global survey on eHealth. Geneva: World Health Organization; 2011 (https://iris.who.int/handle/10665/44607, accessed 7 June 2024).
51. Ruotsalainen P, Blobel B. Future pHealth ecosystem: holistic view on privacy and trust. J Pers Med. 2023;13(7). doi:10.3390/jpm13071048.
52. Philip BJ, Abdelrazek M, Bonti A, Barnett S, Grundy J. Data collection mechanisms in health and wellness apps: review and analysis. JMIR mHealth uHealth. 2022;10(3). doi:10.2196/30468.
53. Hicks JL, Althoff T, Sosic R, Kuhar P, Bostjancic B, King AC, et al. Best practices for analyzing large-scale health data from wearables and smartphone apps. NPJ Digit Med. 2019;2:45. doi:10.1038/s41746-019-0121-1.
54. Salathé M. Digital epidemiology: what is it, and where is it going? Life Sci Soc Policy. 2018;14(1):1. doi:10.1186/s40504-017-0065-7.
55. Eysenbach G. Infodemiology and infoveillance: framework for an emerging set of public health informatics methods to analyze search, communication and publication behavior on the Internet. J Med Internet Res. 2009;11(1):e11. doi:10.2196/jmir.1157.
56. Do Nascimento IJB, Pizarro AB, Almeida JM, Azzopardi-Muscat N, Gonçalves MA, Björklund M, et al. Infodemics and health misinformation: a systematic review of reviews. Bull World Health Organ. 2022;100(9):544–561. doi:10.2471/BLT.21.287654.
57. Șerban O, Thapen N, Maginnis B, Hankin C, Foot V. Real-time processing of social media with SENTINEL: a syndromic surveillance system incorporating deep learning for health classification. Inform Process Manag. 2019;56(3):1166–1184. doi:10.1016/j.ipm.2018.04.011.
58. influenzaNet (https://influenzanet.info/home, accessed 22 June 2024).
59. Outbreaks Near Me (https://outbreaksnearme.org/us/en-US, accessed 22 June 2024).
60. HealthMap (https://healthmap.org/en/, accessed 22 June 2024).
61. Google Trends. Mountain View, CA: Google (https://trends.google.com/trends/, accessed 22 June 2024).
62. Aiello AE, Renson A, Zivich PN. Social media- and internet-based disease surveillance for public health. Annu Rev Public Health. 2020;41:101–118. doi:10.1146/annurev-publhealth-040119-094402.
63. Lazer D, Kennedy R, King G, Vespignani A. The parable of Google Flu: traps in big data analysis. Science. 2014;343(6176):1203–1205. doi:10.1126/science.1248506.