Chapter 19. Assessing inequality using summary measures of health inequality
Overview
Summary measures of health inequality offer a concise way to express the magnitude of inequality in a given health indicator, using a single number. They enable comparisons across time points, health indicators and settings. There are several types of summary measure of inequality, with different applicability depending on the characteristics of the underlying data and the dimensions of inequality that are the focus of the analysis. For example, summary measures can be expressed on an absolute or relative scale. They can draw from two subgroups (pairwise comparisons) or more than two subgroups (complex measures), and they may be weighted or unweighted with regard to population size. Some summary measures rely on the selection of a reference point.
This chapter focuses on summary measures of health inequality related to social inequality (also termed bivariate inequality), whereby inequalities in a population are assessed in relation to subgroups defined by a dimension of inequality, such as age, economic status, education level, place of residence, sex or subnational region. Accordingly, the calculation of such summary measures of inequality requires disaggregated health data from two or more subgroups (see Chapters 20 and 21). Some summary measures, however, can also be calculated using individual-level data (see examples in Chapter 25).
The objective of this chapter is to build a theoretical understanding of the general applications, strengths and limitations of summary measures of health inequality as an extension of disaggregated data analysis. The chapter discusses why summary measures of health inequality are used and introduces their defining characteristics. Subsequent chapters provide a more detailed description of the calculation of pairwise summary measures of health inequality (Chapter 20) and selected complex summary measures of health inequality (Chapter 21). Chapters 22 and 23 address considerations for interpreting and reporting summary measures of inequality.
Why are summary measures of health inequality used?
Summary measures of health inequality provide a means of summarizing information about multiple data points using a single number to express inequality. These measures are calculated from disaggregated data (data broken down by population subgroups defined by a dimension of inequality – see Chapter 11). Accordingly, they represent health inequality associated with a specified demographic, socioeconomic or geographic characteristic, summarizing inequality across two or more subgroups.
Summary measures are used to monitor inequality across population subgroups and assess situations of health inequity (i.e. unfair differences in health). Summary measures provide insight into where differences between social groupings may require intervention or further study. Summary measures may be useful to track progress towards targets to reduce or eliminate inequalities. They can be applied to summarize the extent of progress made towards a target, and how much more progress is needed. The summary measures covered in Chapters 20-21 are descriptive and do not support assertions that, for example, poor health results in socioeconomic disadvantage, or that socioeconomic disadvantage is a cause of poor health.
Summary measures are especially useful when making comparisons of inequality between settings, over time and across health indicators. Although inspection of disaggregated data is important to understand the situation in all subgroups, the interpretation of disaggregated data across multiple countries and many subgroups, time points or indicators can become cumbersome. The use of a summary measure to assess inequality in a health indicator in multiple countries (e.g. between the richest and poorest wealth quintiles in each country) would allow countries to be sorted according to the level of within-country inequality – that is, a cross-country comparison of within-country inequality. Similarly, the use of summary measures for tracking inequality in health between the richest and poorest quintiles within a country each year over a 10-year period would provide information on whether inequalities have grown, narrowed or stayed the same over time. Within a given health topic, comparing the extent of the rich–poor inequality across a range of health indicators would help to indicate where inequalities are most pressing.
In addition to summarizing inequality across multiple subgroups, certain summary measures of inequality may incorporate other information related to the underlying data, such as the population size. Therefore, various summary measures offer unique insights into health inequalities.
Defining characteristics of summary measures
There are multiple summary measures of health inequality, with different applicability (1-3). An understanding of their defining characteristics is necessary, both to inform the appropriate selection of summary measures for a given set of disaggregated data and to ensure an accurate interpretation of the results. The selection of summary measures reflects different aspects of inequality, such as absolute versus relative inequality, or inequality between two subgroups versus more than two subgroups. Some summary measures of inequality can be adapted for use with any set of disaggregated data, but other summary measures of inequality must be selected appropriately in accordance with the characteristics of the underlying data, such as whether the dimension of inequality is inherently ordered or non-ordered. Other distinctions include whether summary measures are weighted or unweighted and the selection of a reference point.
Absolute versus relative summary measures
Summary measures of health inequality can be divided broadly into absolute inequality measures and relative inequality measures. For a given health indicator, absolute inequality measures indicate the magnitude of difference in health between subgroups in absolute terms. Absolute measures remain constant when the health indicator values in all subgroups change by the same amount. They retain the same unit of measure as the health indicator (Box 19.1), which makes the result easy to understand. Absolute measures, however, should not be used to compare the situation across indicators with different units.
BOX 19.1. Percentages or percentage points?
There is a special consideration regarding units of measurement for expressing absolute inequality based on a health indicator measured as a percentage. Percentage is commonly understood to express relative differences (e.g. a 50% increase or a 50% decrease). When expressing absolute inequality based on a health indicator measured as a percentage, the difference between percentages is communicated using percentage points. For example, if coverage in Subgroup A is 80% and coverage in Subgroup B is 40%, it is correct to state that “coverage in Subgroup A is 40 percentage points higher than coverage in Subgroup B”. It is also correct to state that “coverage in Subgroup A is 100% higher than coverage in Subgroup B”. It is incorrect, however, to state that “coverage in Subgroup A is 40% higher than coverage in Subgroup B”.
Relative inequality measures show proportional differences in health among subgroups and have no units. Relative measures remain constant when the health indicator values in all subgroups change by the same proportion. They can be used to compare findings across indicators with different units, but it can be difficult to get a sense of the magnitude of inequality.
Absolute and relative measures of inequality provide complementary perspectives to assess a situation of inequality and both should be calculated and considered when interpreting findings. For example, the coverage of a health intervention in Subgroup A (80%) compared with Subgroup B (40%) could be expressed in absolute terms as a gap of 40 percentage points between Subgroups A and B, or in relative terms as the coverage in Subgroup A being twice as high as in Subgroup B. Neither piece of information in isolation would give a complete sense of the situation of inequality. This is illustrated in Figure 19.1, which shows ratio values corresponding to differences of 40 percentage points and difference values corresponding to ratios of 2.0.
FIGURE 19.1. Illustration of difference and ratio values corresponding to different hypothetical levels of coverage
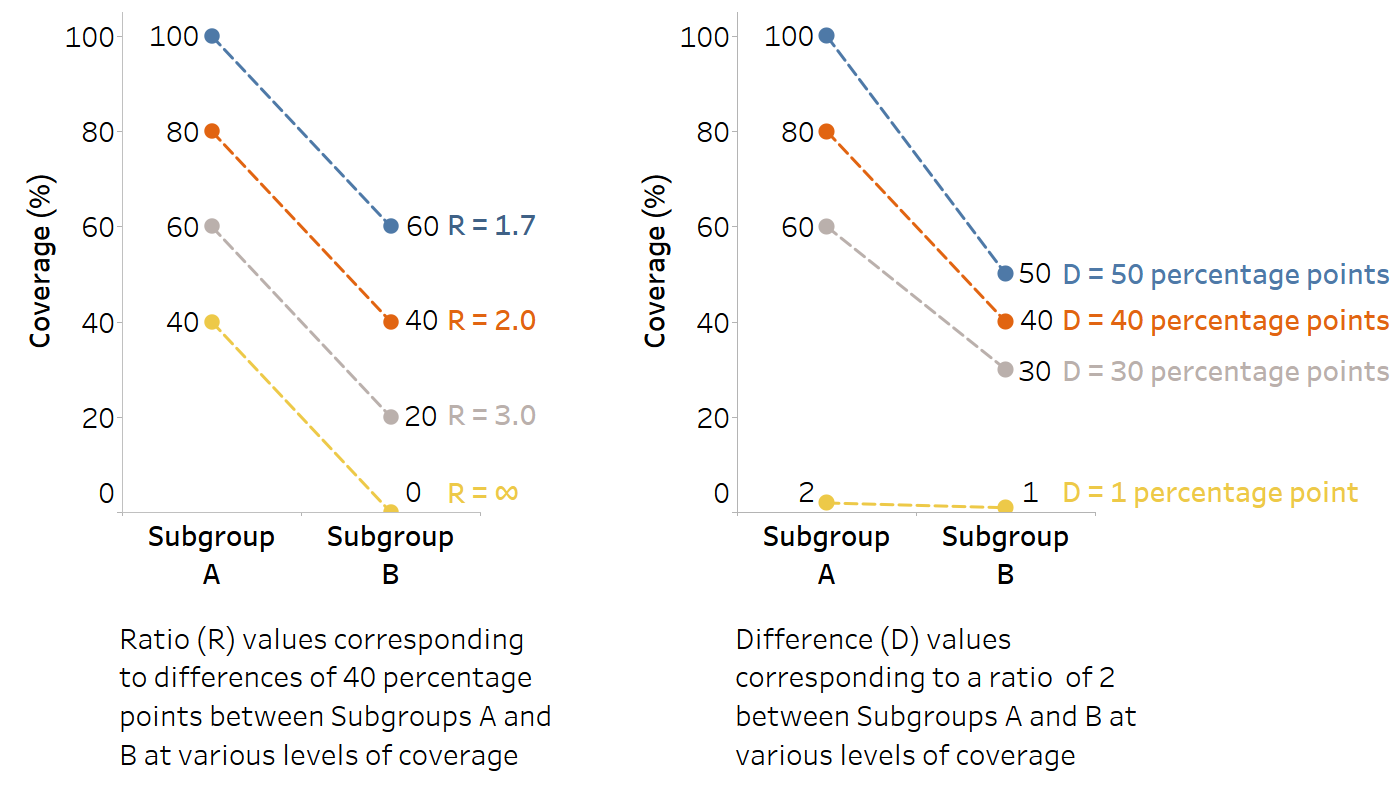
In general, relative measures suggest larger inequality when the denominator has smaller values relative to the value of the numerator (i.e. when the denominator is further away from the numerator). For example, 20/1 = 20, whereas 20/10 = 2. Absolute measures tend to be small at the lower and upper ends of a distribution (e.g. when overall disease prevalence is very low, or when overall coverage or health levels are very high). For example, if the overall prevalence is 1%, the maximum (unweighted) inequality between two subgroups is 2 percentage points (disaggregated data values of 2% and 0%). Similarly, if the overall prevalence is 99%, the maximum inequality between two subgroups is also 2 percentage points (disaggregated data values of 100% and 98%). For more discussion about mathematical considerations when interpreting summary measure results, including the use of absolute and relative measures to assess inequality trends, see Chapter 22.
Pairwise versus complex summary measures
Another major distinction can be made between pairwise (or simple) summary measures and complex summary measures. Pairwise measures make comparisons between two (and only two) subgroups. They can be calculated for any health indicator and dimension of inequality and tend to be intuitive and easy to understand, whether expressed on the absolute (difference) or relative (ratio) scale. Pairwise differences and ratios are especially relevant for dimensions of inequality that are binary – that is, consisting of exactly two subgroups, such as urban versus rural place of residence, or females versus males. For dimensions consisting of more than two subgroups, difference and ratio can still be calculated, but they can take only two of the subgroups into account; the situation in all other subgroups is overlooked or sometimes factored in by collapsing heterogeneous populations into two subgroups. Approaches for selecting subgroups for difference and ratio measures are outlined in Chapter 20, along with other considerations for the calculation of these measures.
Complex summary measures make use of data from all population subgroups to express the level of inequality. For example, a complex measure of inequality can express inequality across all five wealth quintiles, or across all districts in a country. Although complex measures usually apply to dimensions with more than two subgroups, there are a few exceptions. As described below, complex measures may apply to ordered or non-ordered dimensions of inequality and can be characterized further as weighted (accounting for the population size of each subgroup) or unweighted (treating each subgroup as equally sized). In some cases, selection of a reference point may be required, which may be one of the subgroups, the overall average, or another meaningful value such as a target. Chapter 21 covers the calculation of several different classes of complex summary measures, including regression-based measures, ordered disproportionality measures, mean difference measures, variance measures, non-ordered disproportionality measures and impact measures.
Summary measures based on ordered versus non-ordered inequality dimensions
Complex summary measures generally apply to either ordered or non-ordered dimensions of inequality. Subgroups within ordered dimensions of inequality have an inherent positioning and can be ranked. Complex summary measures of inequality that apply to ordered dimensions consider the ordering of the subgroups in their calculation. Age, economic status and education level are examples of ordered dimensions of inequality. In the case of economic status and education level, subgroups can be ordered from the most disadvantaged (poorest or least educated) to the most advantaged (richest or most educated), irrespective of the health status of the subgroup. Age can be ranked from youngest to oldest. The ordered nature of certain dimensions of inequality, however, may be less straightforward. For example, rankings of occupational or social classes are sometimes made, but this can be controversial because it requires a subjective assessment.
Economic status and education level are commonly used to explore variation in health status at varying levels of socioeconomic status – also known as the social gradient in health.
Another set of summary measures is appropriate for use with non-ordered dimensions of inequality. Non-ordered dimensions of inequality are based on criteria that cannot be logically ranked, such as languages spoken, race or ethnicity, or subnational regions.
There may be situations where an ordered characteristic is attached to a non-ordered dimension of inequality. For example, subnational regions could be described according to the average income, population density or level of unemployment, and then ordered from the region with the lowest value to the region with the highest value. In this case, income, population density or unemployment levels (all ordered dimensions of inequality) would be the criteria upon which the regions are ranked, and summary measures of inequality for ordered dimensions would be appropriate.
Weighted versus unweighted summary measures
Summary measures of inequality can be described further as weighted or unweighted. Weighted measures take into account the population size of each subgroup. Unweighted measures treat each subgroup as equally sized. Complex measures may be weighted or unweighted, but pairwise difference and ratio measures are always unweighted. Note that this description of weighting is distinct from the use of sampling weights when preparing data from surveys, discussed in Annex 8.
Weighted summary measures require information about population size or population share. Population size refers to the number of people represented by each subgroup. Population share describes this information as a percentage (i.e. the percentage of the total population represented by each subgroup). For more information, see Chapter 18.
For example, Figure 19.2 shows the population share of women aged 15–49 years by education level in Indonesia in 2007 and 2017. In 2017, 74% of this population had secondary education or higher, 25% had primary education and 1% had no education. The use of a weighted measure of inequality, accounting for the lower percentage of the population in the “no education” subgroup, may suggest a different level of inequality than an unweighted measure, which treats all groups as equally sized. Moreover, population shift across education subgroups over the 10-year period between the surveys is evident. Compared with 2007, the share of the population with secondary or higher education was higher in 2017, and the share of the population with primary or no education was lower. Weighted measures, if used to compare the level of inequality between the two time points, would account for this shift, whereas unweighted measures would not. See Chapter 21 for a corresponding analysis of education-related inequality in births attended by skilled health personnel, measured using weighted and unweighted summary measures.
FIGURE 19.2. Proportion of women aged 15–49 years, by education level, Indonesia
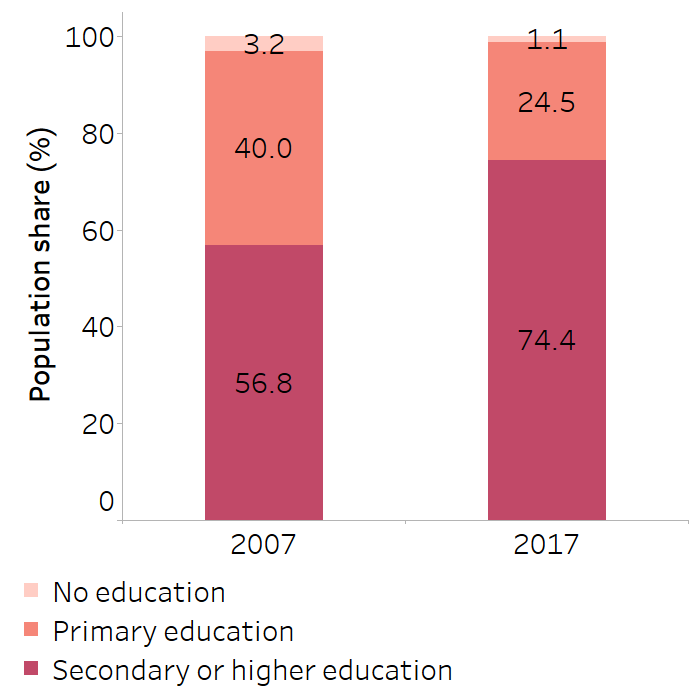
Source: derived from the WHO Health Inequality Data Repository Reproductive, Maternal, Newborn and Child Health dataset (4), with data sourced from the 2007 and 2017 Demographic and Health Surveys for the indicator “births attended by skilled personnel”.
There are two main considerations for the selection of a weighted versus unweighted measure. First, there are methodological reasons. Weighted summary measures account for the distribution of the population across subgroups. If there is a very small subgroup, it is unlikely to have a strong impact on the summary measures if weighted. Weighted measures may, however, be methodologically warranted in some circumstances, such as monitoring health inequalities over time amid a situation of population shift. For example, tracking education-based inequality – as in Figure 19.2, where the population share in the “no education” and “primary education” subgroups decreased over time and the population share in the most educated subgroup increased – the use of a weighted measure would likely capture a reduction of health inequality over time.
A second reason relates to ethical and value judgements (see Chapter 22). Briefly, the use of weighted measures treats all individuals equally. Conversely, unweighted measures treat all subgroups equally. For example, the use of a weighted measure to show inequality between Indigenous versus non-Indigenous subgroups would not capture inequality if the number of individuals in the Indigenous subgroup was much smaller than the number in the non-Indigenous subgroup. In this case, the use of an unweighted measure, which reflects an equal normative status of the subgroups, would be more likely to capture inequality. The ethics and value judgements conveyed through the selection of weighted or unweighted measures are not “right or wrong” or “better or worse” but rather should be considered and acknowledged as an appropriate fit for the circumstances that surround a particular application of monitoring.
Reference points
Complex measures of inequality have specific reference points that serve as benchmarks or points of comparison. There are often several possible reference points that could be selected, depending on the specifics of what is being monitored. Commonly, a reference point is based on a chosen subgroup. For an ordered dimension of inequality, the reference group may be one of the subgroups at the extreme, such as the richest or most educated subgroup. For non-ordered dimensions, a subgroup may be selected for holding special significance, such as the dominant ethnicity or the region where the capital city is located. A reference subgroup may also be selected because it is the best-performing subgroup based on the assumption that its health status is achievable by other subgroups (usually the less advantaged or worse-performing subgroups). This concept is also known as “levelling up” and indicates improvement towards the elimination of inequalities. In some circumstances, reference points other than subgroup values may be specified, such as the overall average of the health indicator or a health indicator target.
To illustrate the use of different reference points, Figure 19.3 shows data about the coverage of births attended by skilled health personnel across 34 subnational regions of Indonesia. Across the four panes of the figure, four distinct reference points are identified. On the left, the selected reference point is the best-performing region (Bali), where the indicator coverage is 100%. Next, Jakarta is highlighted as a potential reference point. This subgroup holds special significance because it is the capital city. A few other regions had higher coverage than Jakarta, but most regions had lower coverage. Another possible reference point is national average, which was around 92% in this example. A defined target value, such as 80% coverage, is the fourth possible reference point highlighted in this example. The use of this reference point illustrates that only a few regions had coverage below the target.
FIGURE 19.3. Illustrating the use of four distinct reference points: births attended by skilled health personnel, by subnational region, Indonesia
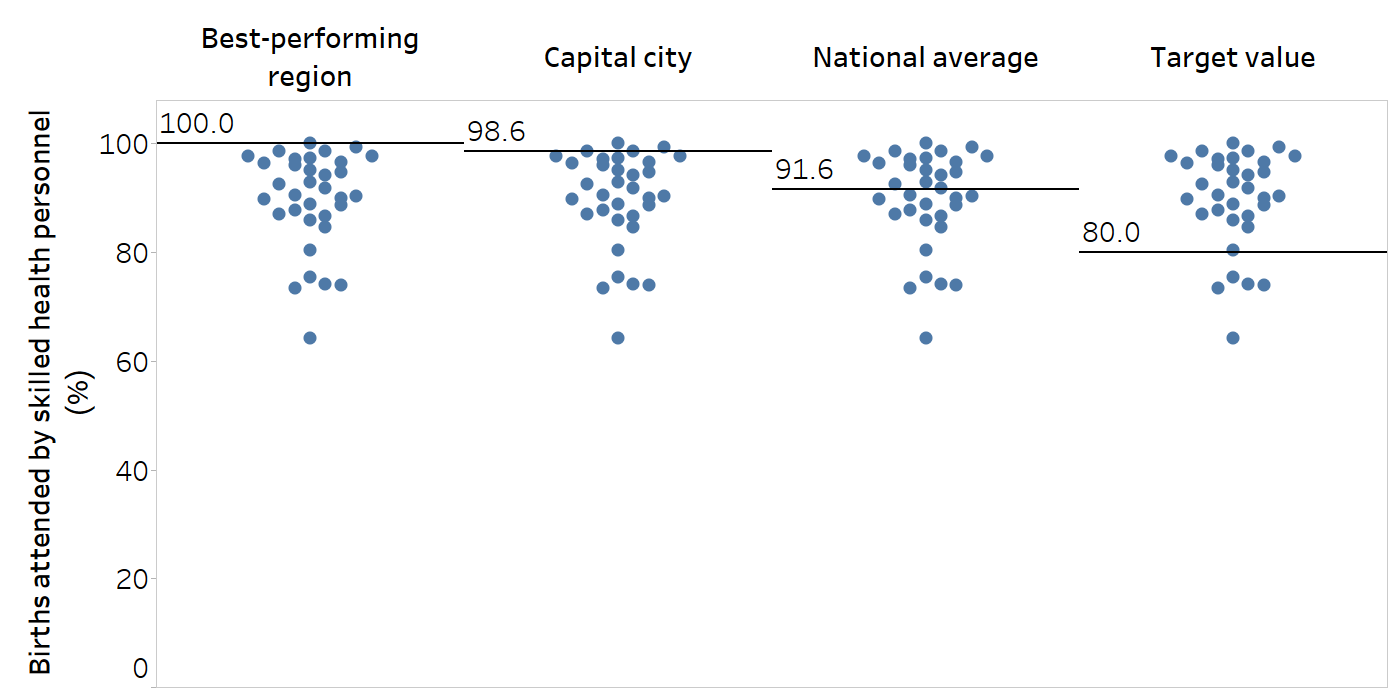
Each subnational region is represented by one circle per column. Horizontal lines indicate the reference points across subnational regions.The best-performing region was Bali. The capital city is Jakarta.
Source: derived from the WHO Health Inequality Data Repository Reproductive, Maternal, Newborn and Child Health dataset (4), with data sourced from the 2017 Demographic and Health Surveys. Data are based on three years prior to the survey.
References
1. Schlotheuber A, Hosseinpoor AR. Summary measures of health inequality: a review of existing measures and their application. Int J Environ Res Public Health. 2022;19(6):3697. doi:10.3390/ijerph19063697.
2. Mackenbach JP, Kunst AE. Measuring the magnitude of socio-economic inequalities in health: an overview of available measures illustrated with two examples from Europe. Soc Sci Med. 1997;44(6):757–771. doi:10.1016/s0277-9536(96)00073-1.
3. Harper S, Lynch J. Methods for measuring cancer disparities: using data relevant to Healthy People 2010 cancer-related objectives. Bethesda, MD: National Cancer Institute; 2005 (https://surveillance.cancer.gov/publications/factsheets/SEER_Health_Disparities-1.pdf, accessed 11 June 2024).
4. Health Inequality Data Repository. Geneva: World Health Organization (https://www.who.int/data/inequality-monitor/data, accessed 29 May 2024).