Annex 13. Comprehensive example showing disaggregated data and pairwise and complex summary measures of health inequality
To illustrate the interpretation of multiple summary measures of inequality, the example in this annex draws on common underlying disaggregated data for two health indicators in Indonesia: the proportion of births attended by skilled health personnel (a favourable health indicator) and the proportion of children aged one year who did not receive any doses of the diphtheria, tetanus toxoid and pertussis (DTP) vaccine (an adverse health indicator). Inequalities are considered by place of residence (a binary dimension), mother’s education (an ordered dimension) and subnational region (a non-ordered dimension). Data are shown for 2007 and 2017. The example includes the underlying disaggregated data and pairwise summary measures of health inequality.
Disaggregated data
An inspection of disaggregated data demonstrates that for both indicators, the urban and most educated subgroups were advantaged (Figure A13.1). Between the two time points, coverage of skilled birth attendance increased, and prevalence of children aged one year who did not receive any doses of the DTP vaccine decreased across all residence areas and education levels. Across 34 subnational regions, improvements were also evident. An initial inspection, however, does not reveal whether and how much inequality reduced over time. Summary measures of inequality facilitate this assessment by quantifying the level of inequality.
FIGURE A13.1. Births attended by skilled health personnel and children aged one year who did not receive any doses of the diphtheria, tetanus toxoid and pertussis (DTP) vaccine, by place of residence, education level and subnational region, Indonesia
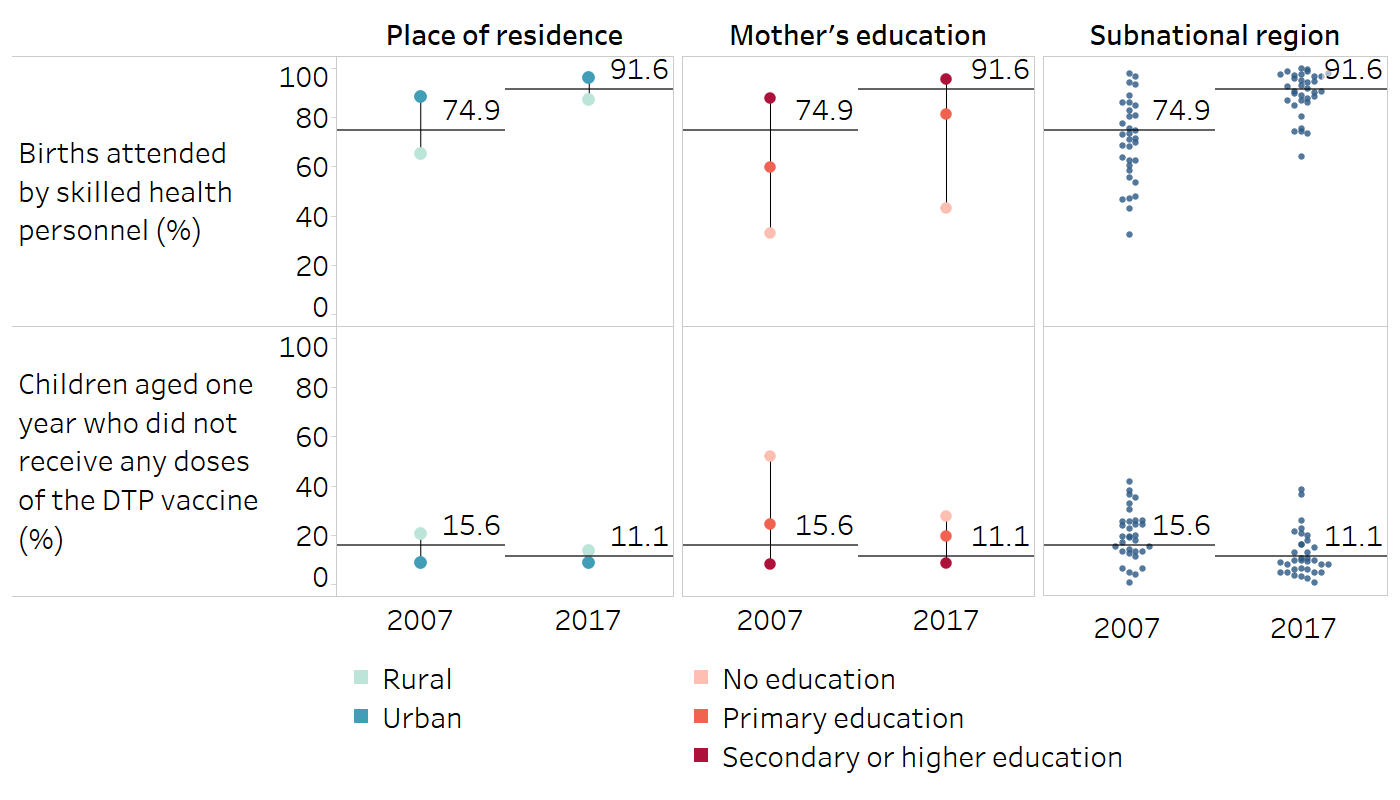
Horizontal lines indicate the national average.
Source: derived from the WHO Health Inequality Data Repository Reproductive, Maternal, Newborn and Child Health dataset (1), with data sourced from the 2007 and 2017 Demographic and Health Surveys. Data for “births attended by skilled health personnel” are based on three years prior to the survey.
Pairwise summary measures of inequality
Figure A13.2 and Figure A13.3 show the results of the difference and ratio calculations. Based on these results, it is evident that both difference and ratio reduced over time for the two indicators and in the case of all three inequality dimensions. Reductions in subnational inequality for births attended by skilled health personnel (calculated based on the highest and lowest of the 34 subgroups) and reductions in education-related inequality in the zero-dose DTP prevalence indicator were particularly notable. These pairwise measures, however, do not account for the changes in the population share over time, and do not capture the situation in the intermediary subgroups for education and subnational region. Complex summary measures of inequality are required to provide further insights.
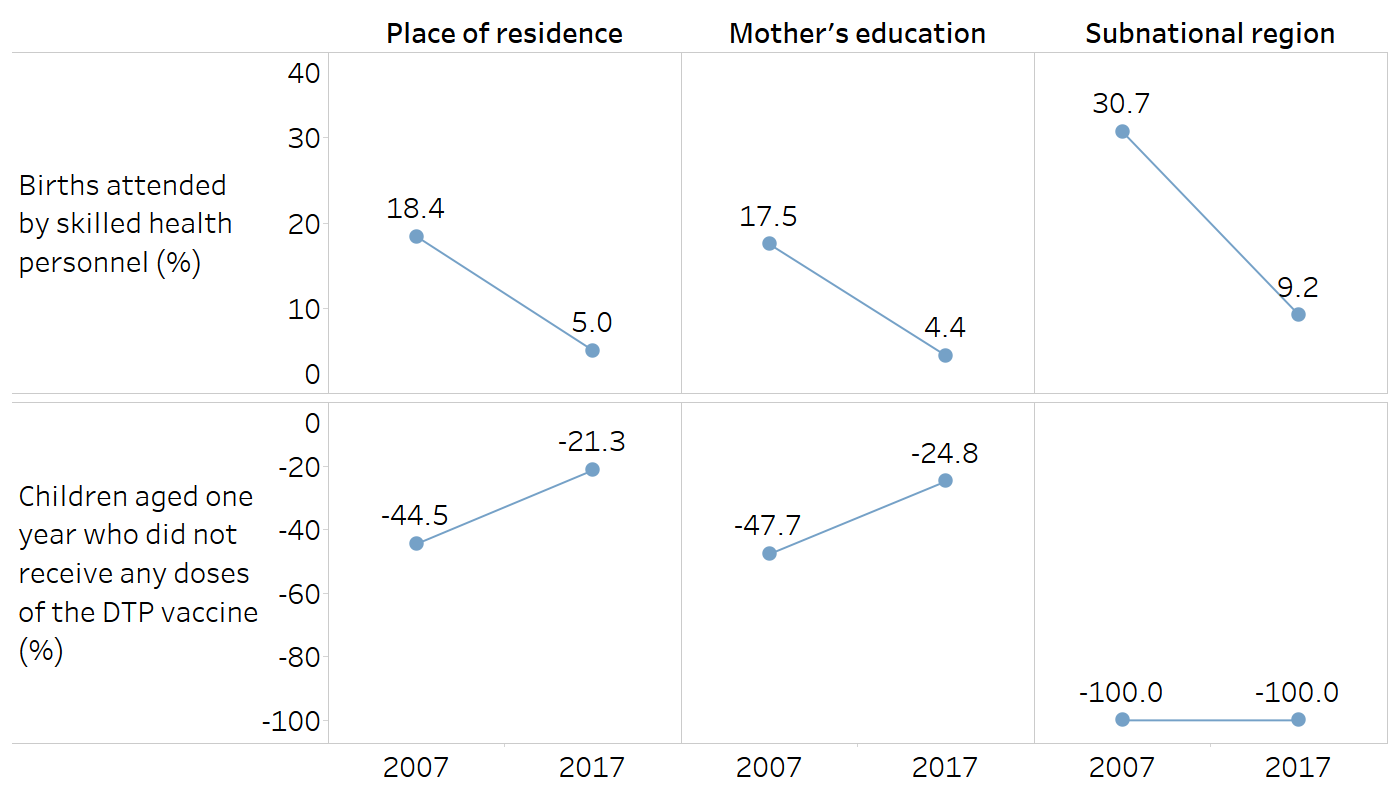
FIGURE A13.2. Difference: births attended by skilled health personnel and children aged one year who did not receive any doses of the diphtheria, tetanus toxoid and pertussis (DTP) vaccine, by place of residence, education level and subnational region, Indonesia
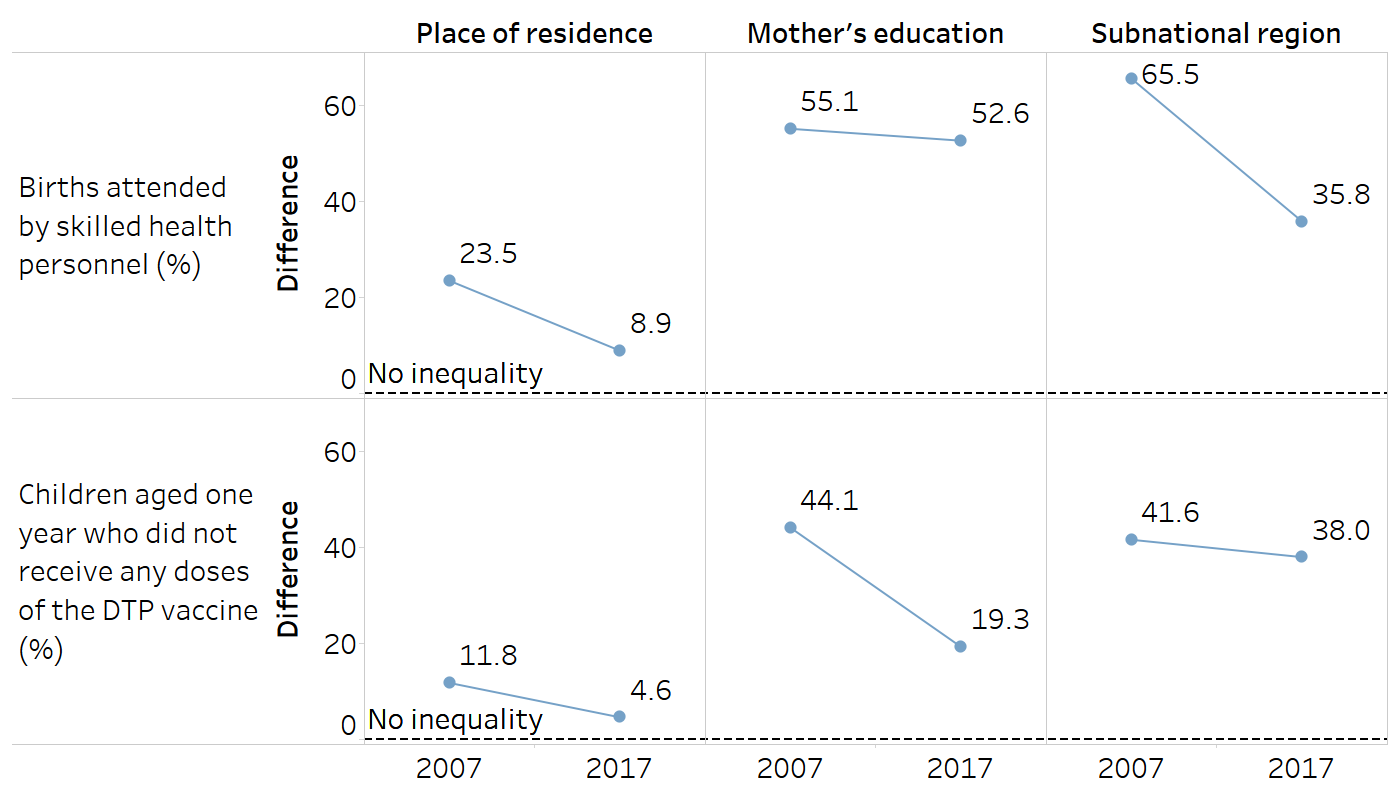
Place of residence is categorized as rural or urban. Mother’s education is categorized as three subgroups, and the difference is calculated based on the most and least educated subgroups. Subnational region includes 34 regions, and the difference is calculated based on the regions with the highest and lowest estimates.
Source: derived from the WHO Health Inequality Data Repository Reproductive, Maternal, Newborn and Child Health dataset (1), with data sourced from the 2017 Demographic and Health Surveys. Data for “births attended by skilled health personnel” are based on three years prior to the survey.
FIGURE A13.3. Ratio: births attended by skilled health personnel and children aged one year who did not receive any doses of the diphtheria, tetanus toxoid and pertussis (DTP) vaccine, by place of residence, education level and subnational region, Indonesia
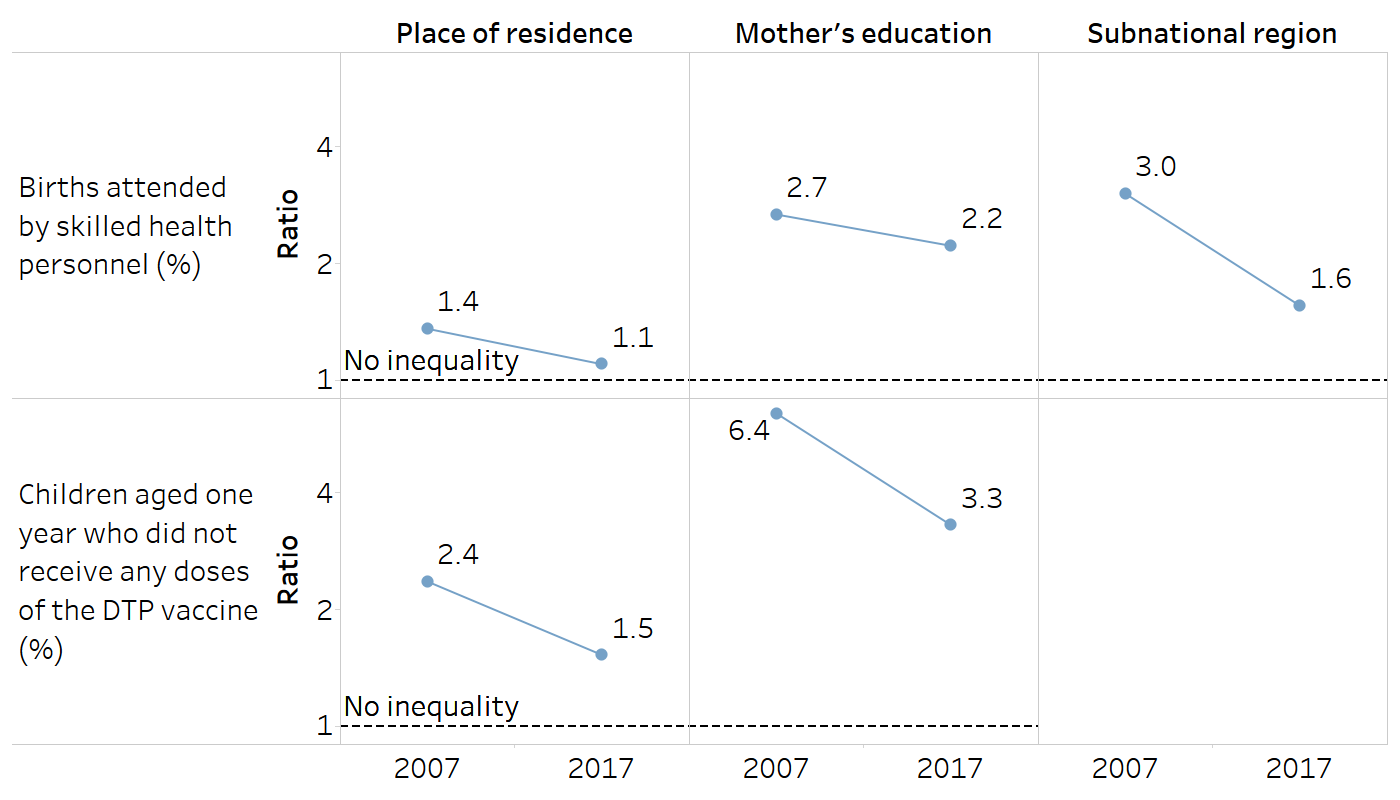
Place of residence is categorized as rural or urban. Mother’s education is categorized as three subgroups, and the ratio is calculated based on the most and least educated subgroups. Subnational region includes 34 regions, and the ratio is calculated based on the regions with the highest and lowest estimates. The ratio could not be calculated for subnational region inequality in the zero-dose DTP prevalence indicator because the regions with the lowest estimate reported 0%.
Source: derived from the WHO Health Inequality Data Repository Reproductive, Maternal, Newborn and Child Health dataset (1), with data sourced from the 2017 Demographic and Health Surveys. Data for “births attended by skilled health personnel” are based on three years prior to the survey.
Regression-based measures
Regression-based measures were calculated for the ordered inequality dimension of education. Figure A13.4 shows that absolute education-related inequality, measured by the slope index of inequality (SII), nearly halved between 2007 and 2017 for both skilled birth attendance and zero-dose DTP prevalence. In 2007, there was a difference of 56.0 percentage points between the most and least educated in skilled birth attendance, which reduced to 27.5 percentage points in 2017. (Recall that the difference measure suggested a more moderate decrease.) Similarly, in 2007, there was a difference of −35.2 percentage points between the most and least educated in zero-dose DTP prevalence, which reduced to −19.7 percentage points in 2017.
Figure A13.4 shows that relative inequality, measured by the relative index of inequality (RII), decreased for both indicators between 2007 and 2017. In 2007, coverage of skilled birth attendance was 2.4 times higher among the most educated compared with the least educated, and in 2017 it was 1.4 times higher. Zero-dose DTP prevalence among the most educated was 0.1 times the prevalence of the least educated in 2007, and 0.2 times the prevalence in 2017. Equivalently, the zero-dose DTP prevalence among the least educated was 10 times higher than among the most educated in 2007 and five times higher in 2017.
FIGURE A13.4. Slope index of inequality and relative index of inequality: births attended by skilled health personnel and children aged one year who did not receive any doses of the diphtheria, tetanus toxoid and pertussis (DTP) vaccine, by education level, Indonesia
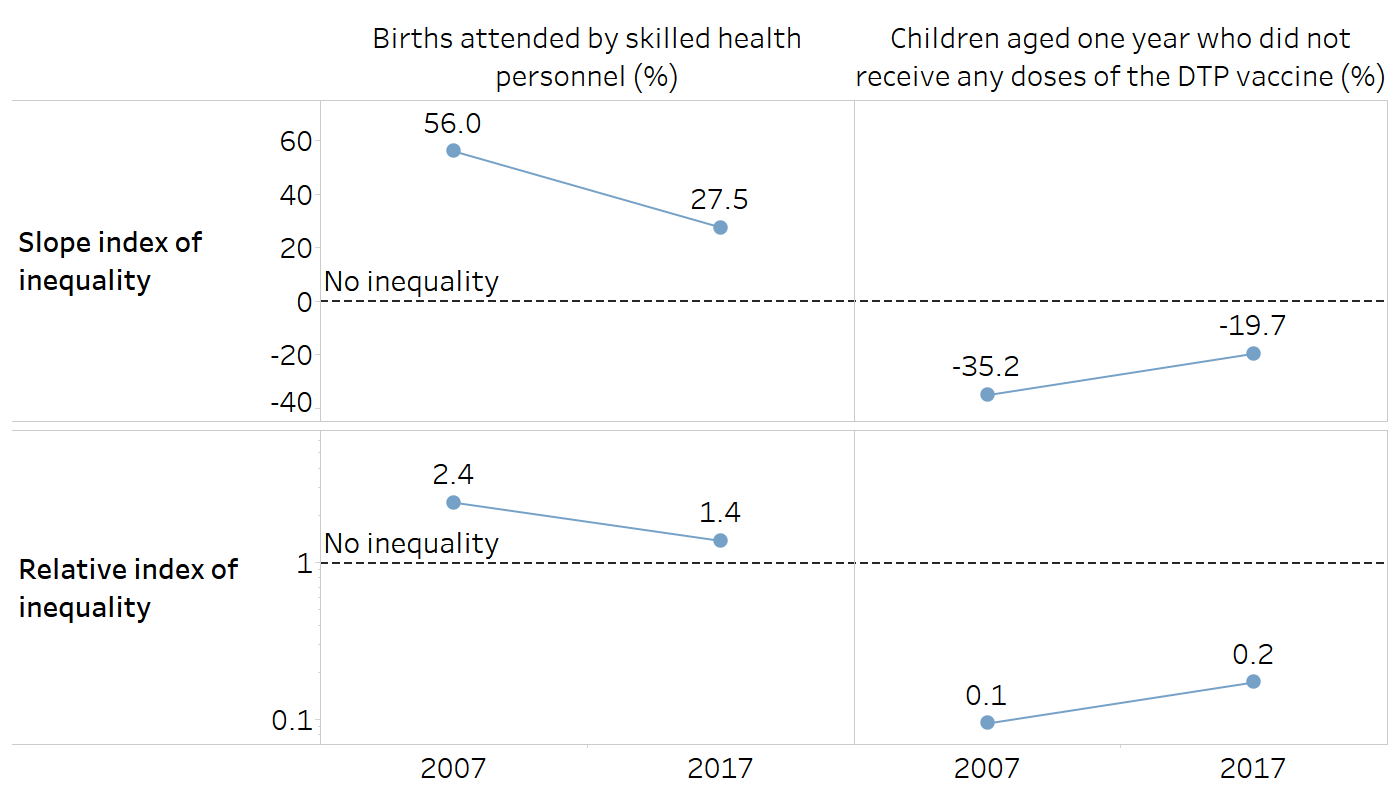
Source: derived from the WHO Health Inequality Data Repository Reproductive, Maternal, Newborn and Child Health dataset (1), with data sourced from the 2007 and 2017 Demographic and Health Surveys. Data for “births attended by skilled health personnel” are based on three years prior to the survey.
Ordered disproportionality measures
Figure A13.5 shows the absolute concentration index (ACI) and the relative concentration index (RCI) for education-related inequality in two maternal and child health indicators. The ACI shows reduced inequality over time for both indicators. In 2007, skilled birth attendance was largely concentrated among mothers with higher education levels (ACI = 7.8 percentage points), and zero-dose DTP prevalence was largely concentrated among children of mothers with lower education levels (ACI = −4.5 percentage points). This inequality more than halved by 2017 for skilled birth attendance (ACI = 3.1 percentage points) and zero-dose DTP prevalence (ACI = −2.1 percentage points).
Figure A13.5 shows that relative inequality, measured by the RCI, also reduced between 2007 and 2017 for both indicators. For 2007, the RCI indicates a concentration of skilled birth attendance among mothers with higher education (RCI = 10.4) and a concentration of zero-dose DTP prevalence among children of mothers with lower education (RCI = −29.0). This inequality reduced over time for skilled birth attendance (RCI = 3.4 in 2017) and zero-dose DTP prevalence (RCI = −18.8 in 2017).
FIGURE A13.5. Absolute concentration index and relative concentration index: births attended by skilled health personnel and children aged one year who did not receive any doses of the diphtheria, tetanus toxoid and pertussis (DTP) vaccine, by education level, Indonesia
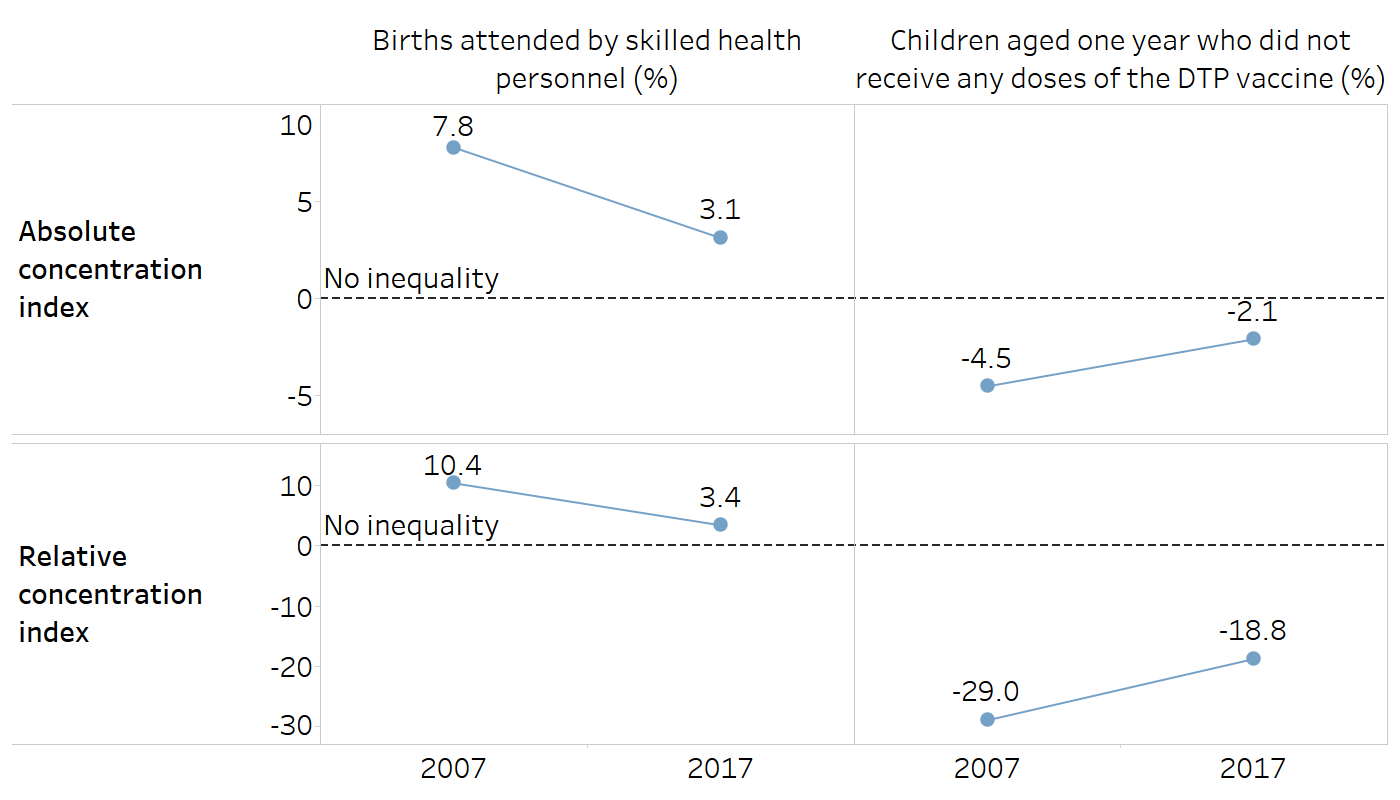
Source: derived from the WHO Health Inequality Data Repository Reproductive, Maternal, Newborn and Child Health dataset (1), with data sourced from the 2007 and 2017 Demographic and Health Surveys. Data for “births attended by skilled health personnel” are based on three years prior to the survey.
Mean difference measures
Figure A13.6 shows the mean difference from the best-performing subgroup (MDB), the mean difference from the reference point (MDR), the mean difference from the mean (MDM), and the index of disparity (IDIS) results for subnational inequality for two maternal and child health indicators in Indonesia. For this example, the weighted version of each measure is included.
For births attended by skilled health personnel, the MDB suggests that, on average, the coverage in subnational regions was 23.0 percentage points below the best-performing region in 2007 (Jakarta, 97.8%). In 2017, coverage was, on average, 8.4 percentage points below the best-performing region (Bali, 100.0%).
For the zero-dose DTP prevalence indicator, the mean difference from the best-performing subgroup was 15.6 percentage points in 2007 (Yogyakarta, 0.0%) and 11.1 percentage points in 2017 (North Sulawesi, 0.0%).
The MDR shows a similar decline in absolute subnational inequality over time in skilled birth attendance and zero-dose DTP prevalence. A large reduction is evident for skilled birth attendance, with coverage varying on average from the reference point Jakarta by 23.0 percentage points in 2007 and by 7.0 percentage points in 2017. A smaller reduction can be observed for zero-dose DTP prevalence, with a mean difference from the reference point Jakarta of 7.3 percentage points in 2007 and 6.6 percentage points in 2017.
Measured using the MDM, absolute subnational inequality in skilled birth attendance nearly halved between 2007 and 2017. In 2007, coverage in subnational regions varied on average by 10.5 percentage points from the national average (74.9%). In 2017, coverage varied on average by 5.3 percentage points from the national average (91.6%). Absolute subnational inequality in zero-dose DTP prevalence reduced slightly, with an MDM of 7.9 percentage points in 2007 and 6.3 ercentage points in 2017.
Figure A13.6 shows the change in relative subnational inequality, measured by the weighted IDIS, over time. Inequality in skilled birth attendance more than halved (weighted IDIS = 14.0% in 2007 and 5.8% in 2017), but there was a slight increase in inequality over time for zero-dose DTP prevalence (weighted IDIS = 50.5% in 2007 and 56.5% in 2017).
FIGURE A13.6. Weighted mean difference measures: births attended by skilled health personnel and children aged one year who did not receive any doses of the diphtheria, tetanus toxoid and pertussis (DTP) vaccine, by subnational region, Indonesia
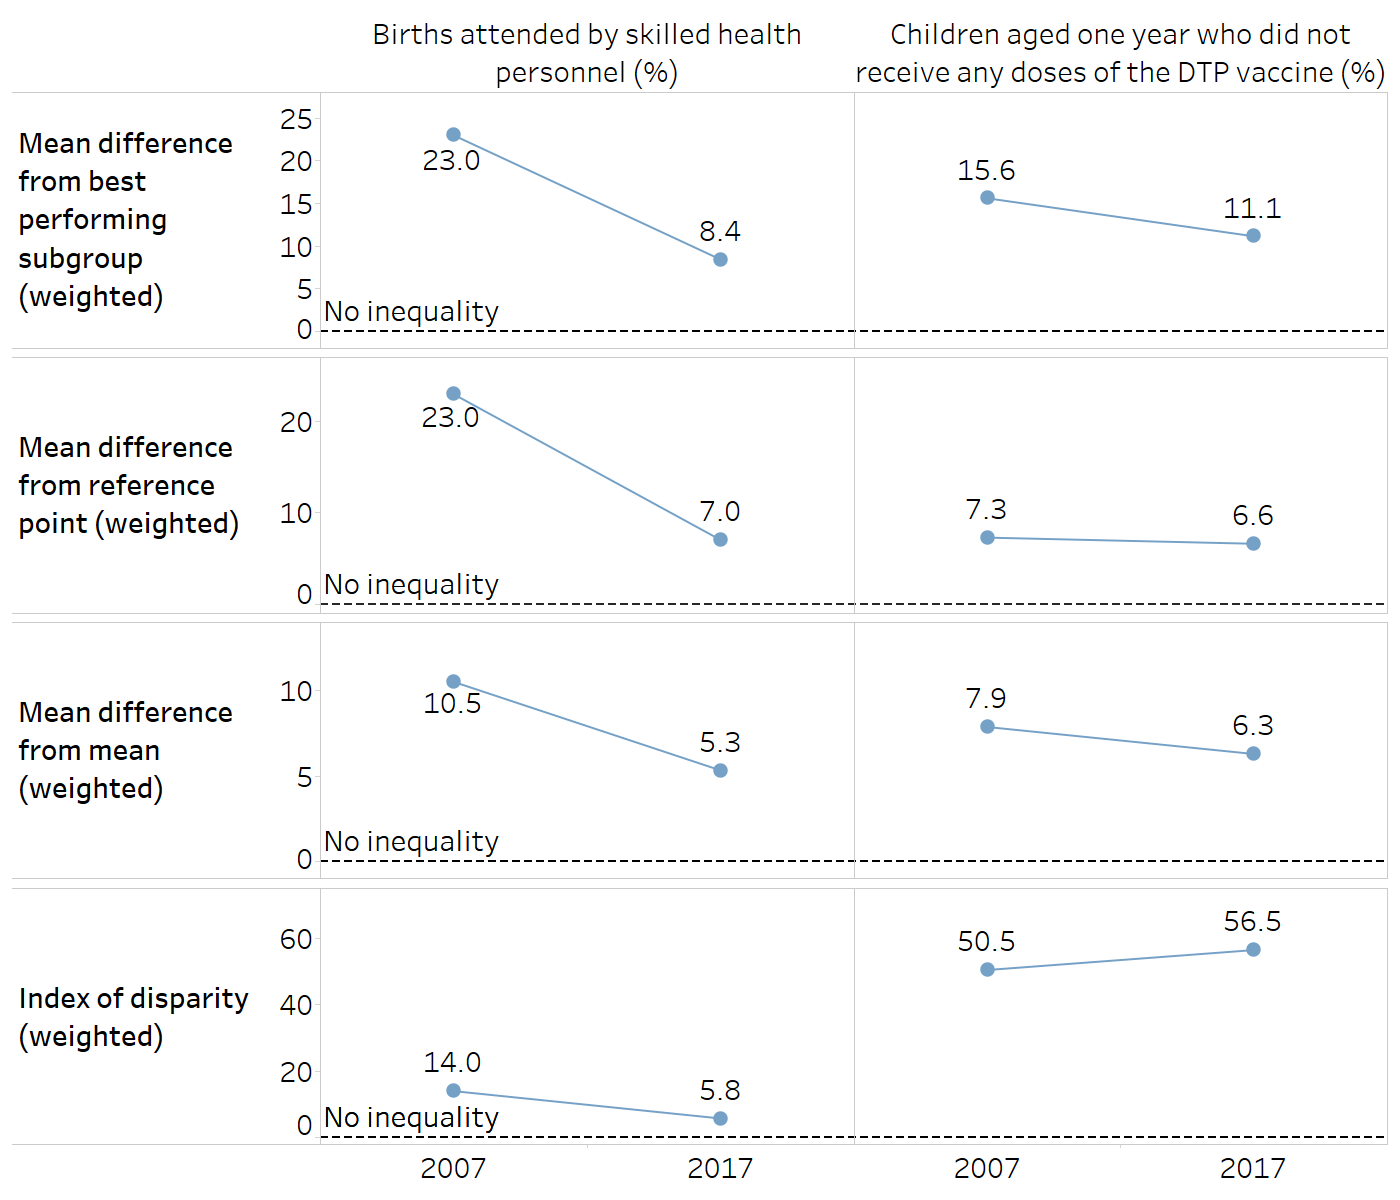
Source: derived from the WHO Health Inequality Data Repository Reproductive, Maternal, Newborn and Child Health dataset (1), with data sourced from the 2007 and 2017 Demographic and Health Surveys. Data for “births attended by skilled health personnel” are based on three years prior to the survey.
Variance measures
Figure A13.7 shows the between-group variance (BGV), the between-group standard deviation (BGSD) and the coefficient of variation (COV) for subnational inequality for two maternal and child health indicators in Indonesia. Absolute subnational inequality, as measured by the BGV, reduced over time for both skilled birth attendance and zero-dose DTP prevalence. The BGV shows a large decline for skilled birth attendance (BGV = 170.0 squared percentage points in 2007 and 50.4 squared percentage points in 2017). A smaller reduction is evident for zero-dose DTP prevalence (BGV = 96.3 squared percentage points in 2007 and 70.0 squared percentage points in 2017).
Like the BGV, the BGSD shows a decline in absolute subnational inequality over time in skilled birth attendance and zero-dose DTP prevalence. The reduction is more pronounced for skilled birth attendance (BGSD = 13.0 percentage points in 2007 and 7.1 percentage points in 2017) and less for zero-dose DTP prevalence (BGSD = 9.8 percentage points in 2007 and 8.4 percentage points in 2017).
Similar to IDIS, COV shows a reduction in relative subnational inequality over time for skilled birth attendance (COV = 17.4% in 2007 and 7.8% in 2017), but an increase for zero-dose DTP prevalence (COV of 62.9% in 2007 and 75.1% in 2017).
FIGURE A13.7. Variance measures: births attended by skilled health personnel and children aged one year who did not receive any doses of the diphtheria, tetanus toxoid and pertussis (DTP) vaccine, by subnational region, Indonesia
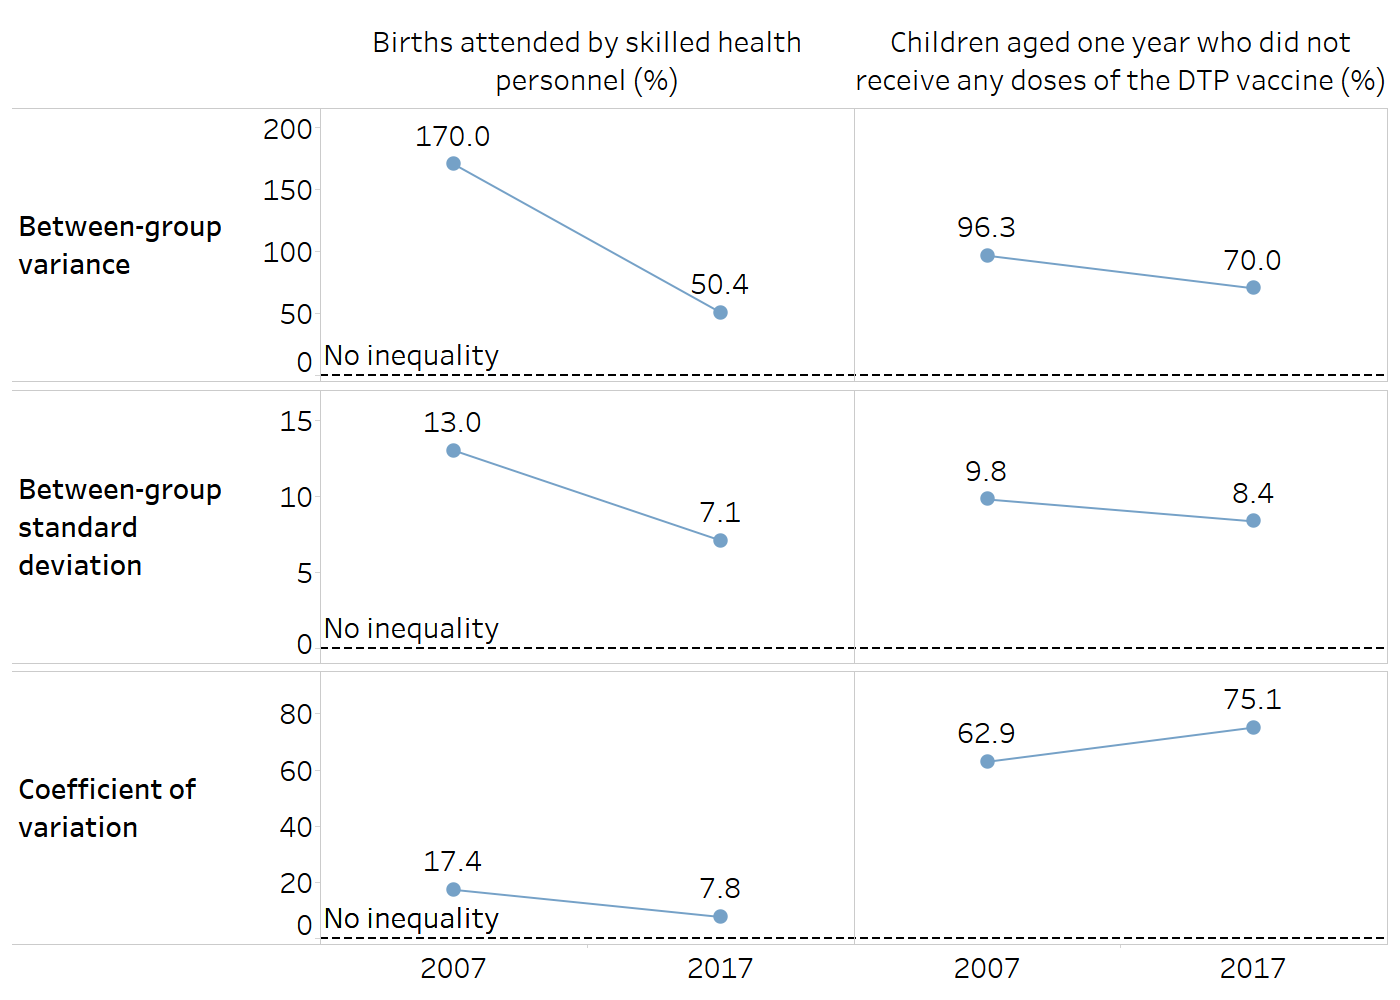
Source: derived from the WHO Health Inequality Data Repository Reproductive, Maternal, Newborn and Child Health dataset t (1), with data sourced from the 2007 and 2017 Demographic and Health Surveys. Data for “births attended by skilled health personnel” are based on three years prior to the survey.
Non-ordered disproportionality measures
The Theil index (TI) and mean log deviation (MLD) measures show the extent of relative subnational inequality in two maternal and child health indicators in Indonesia Figure A13.8). The TI and MLD suggest a reduction in relative subnational inequality in skilled birth attendance over time (TI = 16.0 in 2007 and 3.1 in 2017; MLD = 17.3 in 2007 and 3.3 in 2017). Conversely, although the MLD also shows a small decrease in subnational regional inequality in zero-dose DTP prevalence over time (MLD = 389.2 in 2007 and 376.2 in 2017), the TI demonstrates a large increase (TI = 197.3 in 2007 and 248.5 in 2017).
FIGURE A13.8. Theil index and mean log deviation: births attended by skilled health personnel and children aged one year who did not receive any doses of the diphtheria, tetanus toxoid and pertussis (DTP) vaccine, by subnational region, Indonesia
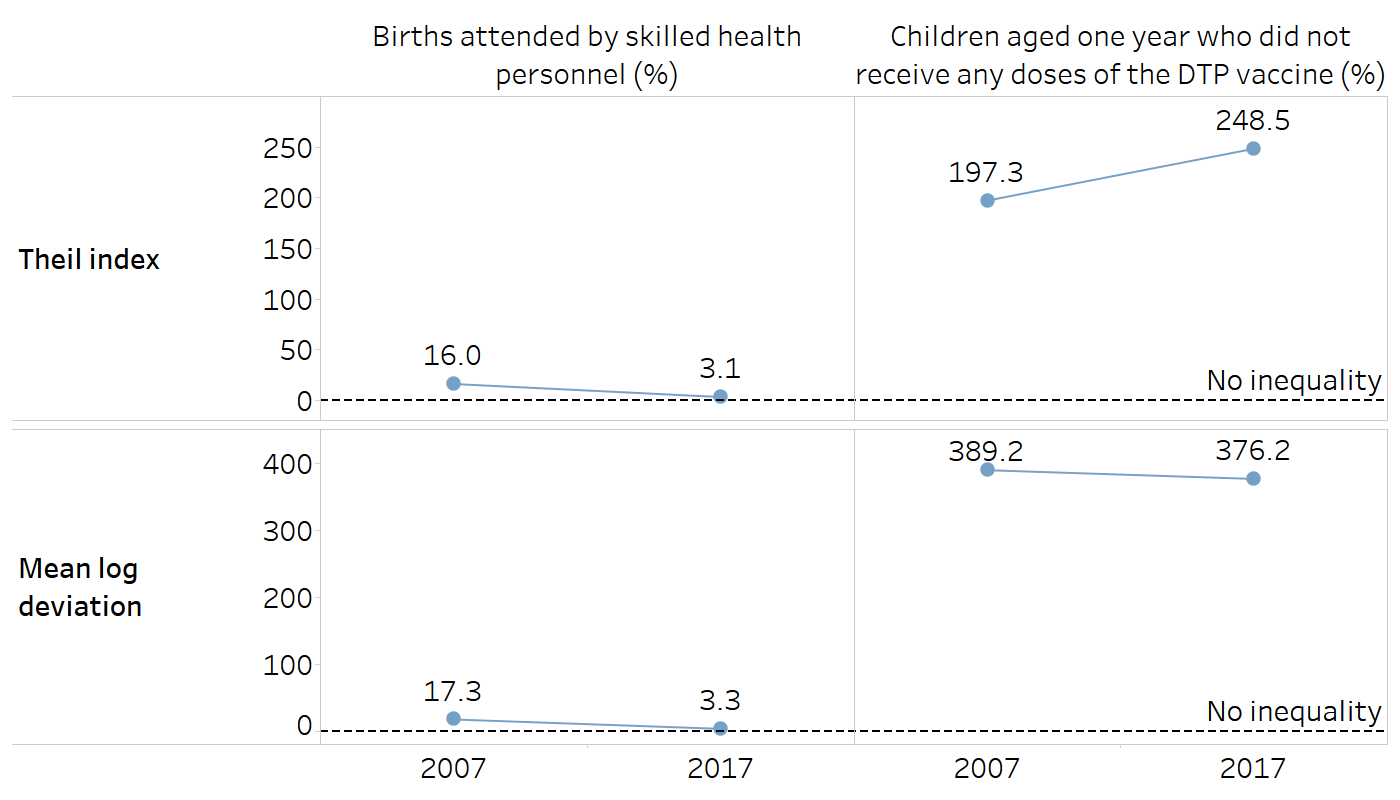
Source: derived from the WHO Health Inequality Data Repository Reproductive, Maternal, Newborn and Child Health dataset (1), with data sourced from the 2007 and 2017 Demographic and Health Surveys. Data for “births attended by skilled health personnel” are based on three years prior to the survey.
Impact measures
Figure A13.9 and Figure A13.10 illustrate the impact measures population attributable risk (PAR) and population attributable fraction (PAF), which can be applied to both ordered and non-ordered subgroups. For both indicators and across all three inequality dimensions, PAR values were smaller (in absolute terms) in 2017 compared with 2007, suggesting the potential for improvement has declined due to decreasing inequality. In 2017, however, the results indicated the possibility of improvements by addressing subnational inequality in both skilled birth attendance (PAR = 8.4 percentage points) and zero-dose DTP prevalence (PAR = −11.1 percentage points). PAF results also suggested decreasing potential for improvement in 2017 compared with 2007. In the case of subnational inequality in the zero-dose DTP prevalence indicator, PAF suggested a 100% improvement to the national average, if all regions were to achieve the same level as the best-performing region (i.e. zero prevalence of zero-dose DTP).
FIGURE A13.9. Population attributable risk: births attended by skilled health personnel and children aged one year who did not receive any doses of the diphtheria, tetanus toxoid and pertussis (DTP) vaccine, by place of residence, education level and subnational region, Indonesia

The figure shows absolute potential for improvement in the national average by eliminating inequality.
Source: derived from the WHO Health Inequality Data Repository Reproductive, Maternal, Newborn and Child Health dataset (1), with data sourced from the 2007 and 2017 Demographic and Health Surveys. Data for “births attended by skilled health personnel” are based on three years prior to the survey.
FIGURE A13.10. Population attributable fraction: births attended by skilled health personnel and children aged one year who did not receive any doses of the diphtheria, tetanus toxoid and pertussis (DTP) vaccine, by place of residence, education level and subnational region, Indonesia
The figure shows relative potential for improvement in the national average by eliminating inequality.
Source: derived from the WHO Health Inequality Data Repository Reproductive, Maternal, Newborn and Child Health dataset (1), with data sourced from the 2007 and 2017 Demographic and Health Surveys. Data for “births attended by skilled health personnel” are based on three years prior to the survey.
Reference
1. Health Inequality Data Repository. Geneva: World Health Organization (https://www.who.int/data/inequality-monitor/data, accessed 20 June 2024).