Chapter 15. Selecting data sources and addressing data gaps
Overview
Health inequality monitoring requires data, which may be obtained from a variety of different sources. The selection of a data source or sources with sufficient and adequate data for health inequality monitoring requires consideration of data availability (what sources exist, what data do they contain and how easily can they be accessed?); data quality (what quality standards do the data meet?); and data suitability (how well do the data serve the purpose of a particular inequality monitoring application?). Data may be available from multiple potential sources, but there are other cases where sources do not contain all relevant data or the data are of poor quality or are otherwise inadequate. In some cases, data sources may be lacking altogether, indicating that efforts and investments may be needed to develop them.
Building on Chapters 12–14, which overview the main data sources used for health inequality monitoring, this chapter considers how to select data sources for health inequality monitoring. It provides strategies and insights for assessing data availability, weighing the strengths and limitations of data sources, selecting from among multiple data sources, and navigating situations of low data availability. It introduces techniques such as data source mapping and data source linking, with examples and tools to support these practices.
Assessing data availability
To streamline the assessment of data availability, it is helpful to clarify the general parameters for a specific application of health inequality monitoring – for example, to identify which populations, health topics and/or dimensions of inequality will be the focus of inequality monitoring (see Chapter 3), noting that the specifics of monitoring may be determined or revised based on the availability of data.
Taking an inventory of existing data sources covering the relevant population, health topic or inequality dimension provides insights into the range of existing sources that may be relevant for inequality monitoring. The data source mapping process described below is a systematic approach to cataloguing the contents and characteristics of existing data sources. The common data sources for health inequality monitoring (see Chapters 12–14) provide a solid starting point.
Data source mapping
Data source mapping is an exercise that helps to assess data availability for health inequality monitoring. It is a process by which data sources are systematically enlisted and their properties detailed. Each source is appraised for its suitability for inequality monitoring (1). By creating an inventory of available data, the exercise helps determine where data for health inequality monitoring can be sourced. It also facilitates cross-referencing between data sources. Data source mapping can expose gaps that indicate where additional data collection is required or where means for enabling data links may be introduced.
Data source mapping involves four main steps and a possible fifth step. Creating sequential and cross-referenced tables for each of the steps facilitates the process. Quality assessments of relevant data sources should accompany the data source mapping exercise. Considerations related to data quality can be recorded as notes in the corresponding sections of the tables or as separate documentation (see Chapter 11).
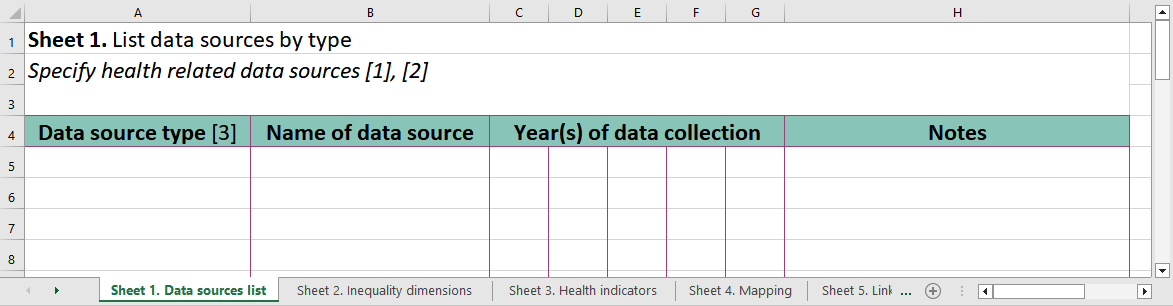
The first step is to create a list of available data sources, specifying the source type (e.g. census, administrative source, household survey, civil registration and vital statistics (CRVS) system), the name of the source, and the year(s) of data collection. Alongside each source, other pertinent information can be noted, such as the frequency of data collection, data representativeness and data accessibility.
The second step involves assessing the dimensions of inequality data contained in each source. This can be done by creating a second table that is an expanded version of the first table, making note of the available dimensions of inequality contained within each source, and the year for which data are available. Quality considerations specific to the corresponding inequality dimension should be recorded. For easy reference during the next steps of data source mapping, each source can be listed in a separate row and assigned a unique data source reference number.
The third step involves assessing the availability of data about health indicators of interest. Health indicators can be listed as rows. The unique data source reference numbers from the second table are indicated for sources that contain corresponding data about the health indicator. If needed, the indicator definition can be noted for future reference. If the definition of an indicator differs between data sources, the indicators should be listed as separate rows. Data quality considerations pertaining to the health indicator should be noted.
The fourth step is to integrate information from the second and third steps. This indicates the data sources that contain both health indicators and dimensions of inequality data. The health indicators remain as rows, and the dimensions of inequality are listed as columns. The unique data source reference numbers are then translated from the second and third tables to show where data are available.
A fifth step entails identifying possibilities for linking data using common identifiers across sources.
The steps of data source mapping, and in particular the type of additional details extracted, can be tailored to reflect the specific application of inequality monitoring. A series of worksheets for data source mapping is available online (Box 15.1). For an example of the application of data source mapping techniques in Indonesia, see Annex 7.
BOX 15.1. Table templates for data source mapping and data source linking
WHO has developed worksheet templates for data source mapping and data source linking. The worksheets allow users to input and organize information about available data sources. They are available online and can be downloaded and modified for use (2).
Selecting among multiple data sources
In some cases, there may be multiple data source options that cover the relevant health indicator or inequality dimension data requirements for the population of interest. These two streams of data for inequality monitoring do not necessarily need to be sourced from a single data source. Indeed, data about health and data about inequality dimensions can be linked across different sources using common identifiers (see Data source linking below).
Situations may arise where data about the same or similar health indicators or inequality dimensions are available in multiple sources. To determine which source is most suitable, the strengths of each data source should be weighed against its limitations. The suitability of a data source can be evaluated in three ways, considering its inherent purpose and attributes, the general data quality, and its relevance to a specific application of inequality monitoring.
The major types of data sources used in health inequality monitoring have different inherent purposes, reflected in their design and the type of information that they collect (see Chapters 12-14). For example, multicountry household health surveys are appropriate for expansive assessments of the state of inequality in the topic covered by the survey, including comparisons across countries. CRVS systems collect a more limited scope of data and are better suited for monitoring certain inequalities related to birth and death indicators within a country (although linking CRVS data with census or institution-based sources may open opportunities for monitoring of other indicators).
Understanding the inherent purpose of the data source (i.e. what the data source is designed to do) allows for assessment of quality (i.e. how well that data source fulfils its stated purpose). General data quality considerations relate to the relevance, credibility, accuracy, timeliness, methodological soundness, accessibility, completeness and reliability of the data (see Chapter 11). For example, the purpose of an institution-based recordkeeping system may be to record detailed health information and basic demographic information for individuals visiting a clinic: a system that relies on non-standardized paper forms is likely to have lower reliability, methodological soundness and accessibility than a system using standardized electronic forms (see Chapter 13).
Taking into account the considerations above, the overarching scope and purpose of a particular application of inequality monitoring help to define what is deemed a “suitable” data source. There will be variability across different inequality monitoring applications in terms of how recent the data need to be; whether data across multiple time points are required; whether combining data across several years is required to have a large enough sample size for disaggregation (see Chapter 17); the frequency at which the data should be collected; and what population (or populations, if benchmarking is a requirement) should be covered by the data source. For example, monitoring inequalities during the peak of a pandemic requires data covering the entire affected population that are produced quickly and are available on a frequent basis (e.g. daily or weekly) without delay.
On a practical note, additional considerations pertain to data accessibility. It is important to consider the requirements to gain permission to access the data, and whether they can reasonably be met within the timeframe of monitoring. Additionally, consider whether the data are available in a format that is compatible with analysis software, and whether they require “cleaning” to remove values that are incorrect, unreliable, duplicated, outlying or otherwise unsuitable.
References
1. Hosseinpoor AR, Nambiar D, Suparmi, Kusumawardani N. Data source mapping: an essential step for health inequality monitoring. Glob Health Action. 2018;11(Suppl. 1):1456743. doi:10.1080/16549716.2018.14567.
2. Data source mapping templates. Geneva: World Health Organization; 2023 (https://www.who.int/data/inequality-monitor/tools-resources, accessed 15 May 2024).
3. Blakely T, Salmond C. Probabilistic record linkage and a method to calculate the positive predictive value. Int J Epidemiol. 2002;31(6):1246–1252. doi:10.1093/ije/31.6.1246.
4. Chetty R, Stepner M, Abraham S, Lin S, Scuderi B, Turner N, et al. The association between income and life expectancy in the United States, 2001–2014. JAMA. 2016;315(16):1750. doi:10.1001/jama.2016.4226.
5. Rea M, Tabor D. Health state life expectancies by national deprivation deciles, England: 2018 to 2020. Newport, United Kingdom: United Kingdom Statistics Authority Office for National Statistics; 2022 (https://www.ons.gov.uk/peoplepopulationandcommunity/healthandsocialcare/healthinequalities/bulletins/healthstatelifeexpectanciesbyindexofmultipledeprivationimd/2018to2020, accessed 15 May 2024).
6. Salway T, Rich AJ, Ferlatte O, Gesink D, Ross LE, Bränström R, et al. Preventable mortality among sexual minority Canadians. SSM Popul Health. 2022;20:101276. doi:10.1016/j.ssmph.2022.101276.
7. Trotta A, Bilal U, Acharya B, Quick H, Moore K, Perner SM, et al. Spatial inequities in life expectancy in small areas of Buenos Aires, Argentina 2015–2017. J Urban Health. 2023;100(3):577–590. doi:10.1007/s11524-023-00730-1.
8. Guidelines for accurate and transparent health estimates reporting. Geneva: World Health Organization (https://www.who.int/data/gather/statement, accessed 29 May 2024).
9. State of inequality: HIV, tuberculosis and malaria. Geneva: World Health Organization; 2021 (https://iris.who.int/handle/10665/350198, accessed 5 June 2024).
10. Victora CG, Boerma T. Inequalities in child mortality: real data or modelled estimates? Lancet Glob Health. 2018;6(5):e477–e478. doi:10.1016/S2214-109X(18)30109-8.