Chapter 17. Preparing disaggregated health data
Overview
Disaggregation is the process of breaking down data into smaller units or sets of observations. For health inequality monitoring, disaggregated health data present information by population subgroups, defined by one or more dimensions of inequality. Disaggregated health data are a requirement for monitoring health inequalities within populations because they allow for comparisons between the health of population subgroups that are not evident from overall averages across a whole population. For example, they facilitate health comparisons between rich and poor populations, across districts within a country, and among groups with distinct levels of education.
The analysis of disaggregated health data provides initial insight into inequalities within a defined population. Disaggregated data are key inputs to calculating summary measures of health inequality. Their characteristics guide the selection of summary measures that are appropriate to describe inequality (see Chapter 19). Careful consideration is warranted, therefore, when defining and calculating health indicators and inequality dimensions and subsequently deriving disaggregated data.
This chapter presents technical considerations related to the preparation of disaggregated health data for analysis, with a focus on health indicator data and dimension of inequality data. The chapter addresses multiple disaggregation and analysis of disaggregated data pertaining to distinct measurement levels (individual, household and small area). This chapter complements Chapter 3, which discusses general considerations and resources to guide the selection of health indicators and inequality dimensions. It is a continuation of the inequality monitoring process that follows the selection of data sources discussed in Chapter 15.
General considerations for preparing data
Preparing disaggregated data for analysis requires a thorough understanding of the dataset. This is derived from reviewing metadata. Metadata – data that define and describe other data – give specific information about data collection and variables. Several types of metadata are important to review. Data sources and processing documentation include information about data entry, data cleaning, data tabulation and recoding of datasets. Information about missing data or imputations in the dataset is particularly important because it helps with understanding potential limitations of, and interpreting, the dataset. Indicator calculation methodology includes the sources for numerators and denominators and details about how to define and construct indicators of interest. Documentation about inequality dimensions details how dimensions are defined and constructed.
Relevant documentation should be collated and updated as the data are further processed and analysed. For instance, data codebooks or dictionaries are documents that detail the variables, structure, content, and layout of datasets. Publishing (or otherwise making available) metadata alongside the reporting outputs of health inequality monitoring enables rigorous inspection of the protocols and decisions used to derive the analysis results, making the analysis more transparent and trustworthy. Detailed metadata can enable replication and assessment of the analysis. Notably, metadata should detail the construction of all variables, including health indicators and dimensions of inequality. For more information about reporting methods and metadata, see Chapter 23.
Part of preparing data may include data cleaning and de-identification. Data cleaning is the process of editing, correcting and structuring data within a dataset so the data are correct, consistent and usable for analysis. Data cleaning may also entail identifying, handling and interpreting missing data. Data cleaning will be more extensive if starting with raw data that have not been previously processed, coded or formatted, than if starting with data that have already been partly or fully processed. Inequality analysis often involves analysing individual-level data from surveys or administrative sources, and therefore it is important that data are de-identified (i.e. personal information is removed). This serves to protect the privacy of individuals if the data or the results of monitoring are shared. See Chapter 4 for more on data security considerations.
When sourcing data from household surveys that rely on complex survey sampling designs, the design of the survey should be taken into consideration and included in the metadata. Complex sampling designs involve the selection of sampling units through multiple stages or phases. Designs include stratification, clustering, multistage sampling and weighting (see Annex 8). Survey datasets do not always include variables for all of these elements – but if they are included, they must be taken into consideration to produce point estimates and standard errors that are accurate and representative of the population. If the characteristics of the sampling design are ignored, disaggregated estimates and confidence intervals might be inaccurate. For example, ignoring clustering will tend to yield standard errors that are too small, while ignoring stratification will tend to yield standard errors that are too large.
Oversampling of minority groups in surveys allows for sufficient sample sizes across population subgroups and helps to ensure disaggregated data can be used for health inequality monitoring.
A variety of analysis software applications may be used for processing and preparing data for analysis. As the functionality of software applications advances, they are increasingly user-friendly and adept with a range of statistical methods and the production of data visuals. WHO has developed statistical codes and eLearning courses to support the use of several software applications, including Excel, R and Stata, for the preparation of disaggregated datasets (1, 2).
Defining and constructing health indicators
For a given health inequality monitoring exercise, one or more health indicators are selected to represent a topic or area of focus. The selection of relevant health indicators requires consideration of the scope of monitoring, policy and planning needs, and contextual and cultural factors (see Chapter 3). Data availability is another consideration. Modelled estimates, which may be used when reliable empirical data are not available, entail certain limitations and assumptions that should be acknowledged and taken into consideration (i.e. that the information on which estimates are based may be outdated, incomplete or derived from a different context) (3). Once health indicators are selected and source data identified, the statistical criteria for indicator definitions must be defined, along with methods for their computation. These specifications should be recorded as part of the accompanying metadata.
Universal and context-specific indicator definitions
There are different approaches to defining health indicators. Universal (or standardized) indicator definitions may be adopted, aligning with criteria published by a group or organization. Where applicable, they specify standard criteria for both numerators and denominators. For example, the Global indicator framework for the Sustainable Development Goals promotes the use of standardized methods for measuring and defining over 230 unique indicators (4). (The Framework also specifies that indicators should be disaggregated, where relevant, by various inequality dimensions.) As another example, the second edition of the WHO Global reference list of 100 core health indicators (plus health-related SDGs) contains universal indicators and corresponding definitions for use in monitoring global health priorities related to health status, risk factors, service coverage and health systems (5). In both examples, the promotion of universal indicator definitions facilitates the comparison of data across settings and over time. For more examples of global health indicator lists, see Chapter 3.
In some cases, it may be preferable to adopt a context-specific (or non-standardized) indicator definition that aligns with a specific priority or accounts for a circumstance particular to the monitoring context. For example, although there are universal indicator definitions for the coverage of modern contraception use, they may need to be adapted in different contexts: the numerator may need to account for the types of contraception methods available within a country, and the denominator may be limited to certain age ranges or to married women due to norms or sensitivity around collecting such information from younger or unmarried women. Similarly, for the indicator of coverage of births attended by a skilled birth attendant, the question of which types of health professionals are considered to be skilled attendants may be answered differently across countries, depending on local education and training requirements. In other cases, context-specific indicator definitions may reflect constraints related to data collection or availability.
Composite health indicators
A composite health indicator is an index composed of several individual indicators within a health topic. The main benefits of using composite health indicators lie in their potential to summarize information across multiple indicators, providing a concise metric that can be compared over time or between populations. The use of data across multiple individual indicators provides a larger number of underlying observations, which may enhance the statistical reliability of the indicator.
There are certain limitations to the use of composite health indicators (6). There may be a lack of transparency about the components of composite indicators, and the underlying data, measures and statistical methods. Compared with simple indicators, composite indicators are more disconnected from the underlying health phenomenon being measured and may mask the differences and relationships between component indicators. Composite indicators can be flawed by virtue of any of their components being biased.
The development of high-quality composite indicators is a technically rigorous process. It entails development of a theoretical framework, selection of indicators, multivariable assessment of indicators, weighting and aggregation of indicators, and validation of the composite indicator (7). Several examples of universal composite health indicators have been developed for global monitoring across different topics, including universal health coverage, using the service coverage index (8); reproductive, maternal, newborn and child health, using the composite coverage index (9); and women’s social independence, using the survey-based women’s empowerment index (10).
Absolute and relative scales
Health indicators are generally measured as absolute counts or in relative terms such as proportions or rates. Health indicators that reflect absolute counts measure the number of occurrences or events in a defined time and place. For example, the number of maternal deaths and the amount of government health expenditure are absolute counts. A limitation of absolute counts is that it is difficult to make comparisons between populations with different sizes or age structures. Absolute counts can, however, be useful to understand the overall situation in a given context. They can provide numerator values for relative measures.
Indicators measured in relative terms are constructed as ratios by dividing one quantity (the numerator) by another (the denominator). A proportion is a type of ratio where the numerator is a subset of the denominator. For example, the percentage of births attended by skilled health personnel is the number of births attended by skilled health personnel (numerator), divided by the total number of live births (denominator). HIV-related mortality has been defined as the total number of people who have died from HIV-related causes per 1000 population. A rate is a type of ratio measuring the frequency of occurrence in a population over a specified period. For example, the adult mortality rate may be defined as the probability of dying between the ages of 15 and 60 years per 1000 population per year. The adolescent fertility rate has been defined as the number of births to women aged 15–19 years per 1000 women in that age group per year. For inequality analyses, there are advantages to using health indicators expressed in relative terms because they permit more salient comparisons between population subgroups, between settings and over time.
Crude and standardized indicators
In some cases, indicators may be specified as crude or standardized. Crude estimates express the numerator as a proportion of the current affected population (the denominator). Standardized estimates, sometimes termed adjusted estimates, account for variables that would be expected to hinder comparisons between two populations or two points in time, such as age or sex distribution. For instance, age-standardized estimates of hypertension may be preferable to crude estimates if comparing the prevalence of hypertension (which is known to increase with age) between populations with different age structures, or within the same population over time.
Linking data sources to calculate indicators
The calculation of health indicators, typically performed using statistical software, may involve linking between sources that contain data about either the numerator or the denominator of a health indicator. This process is the same as the data source linking protocol described in Chapter 15, relying on the presence of a common identifier in both sources. Data source linking is subject to certain limitations that arise if data are collected at different points in time, if different data collection methods are used, or if the population represented in the numerator is not the same as the population represented in the denominator (applicable if data are linked at a small-area level). Linking between data sources, however, is a common practice in health monitoring. For examples of linking between sources to construct health indicators, see Box 17.1.
BOX 17.1. Examples of linking between sources to construct health indicators
The following examples showcase the use of numerator and denominator data from distinct sources, linked through a common identifier, to calculate health indicators:
WHO Global Health Estimates, including indicators related to death and disability, are produced using data from multiple consolidated sources, including national vital registration data, estimates from WHO technical programmes, United Nations partners and interagency groups, and the Global Burden of Disease and other scientific studies (11).
COVID-19 mortality in Canada was assessed using information from vital statistics systems about the number of deaths, combined with population denominator information from the census (12). In one case, the source was an integration of data from the 2016 short-form Canadian census and provisional COVID-19 mortality data from the Canadian Vital Statistics – Deaths database (13). This data linkage allowed an identification of COVID-19 mortality rates between 1 January 2020 and 31 March 2021 across the social and demographic characteristics of individuals living in private dwellings. In another case, the source was an integration of the 2016 census area profile data with preliminary COVID-19 mortality data from the Canadian Vital Statistics – Deaths database (13). This second data linkage allowed an identification of COVID-19 mortality rates between 1 January and 31 December 2020 across neighbourhood-level social and economic characteristics.
An analysis of COVID-19 vaccination inequality in California in the United States of America used data about the cumulative count of residents vaccinated in each county (numerator, collected from the California Health and Human Services Agency), linked to data about the total population of each county (denominator, collected from the 2019 census), to produce estimates of the daily proportion of residents vaccinated in each county (14). These data were then linked to county-level sociodemographic vulnerability index scores to explore trends in sociodemographic-related inequalities in vaccine coverage.
Another possibility exists in linking individual-level data to create longitudinal indicators, which could be used to highlight inequalities over time and along a continuum of care. In well-developed health systems, for example, individuals with cancer may be tracked from first presentation, to diagnosis, treatment and outcomes. These linked data could enable an understanding of inequalities along the pathway if combined with other sources of data about the individual, such as economic status, ethnicity, place of residence and sex.
Measuring and categorizing dimensions of inequality
Alongside health indicators, dimensions of inequality – the criteria upon which population subgroups are categorized for inequality monitoring – represent the other stream of information contained in disaggregated health data. Some of the dimensions of inequality commonly used in health inequality monitoring include age, economic status, education level, place of residence, sex and subnational region, although there are many others with global and local applicability. Similar to the process of selecting health indicators, the dimensions of inequality selected for inequality monitoring should align with the scope, purpose, context and data availability of the monitoring exercise. See Chapter 3 for more on inequality dimensions.
Dimensions of inequality may be defined, measured and categorized into subgroups in different ways, which should be noted in metadata. Increasingly, standardized approaches are being developed to promote consistency and comparability in how dimensions of inequality are measured and categorized into subgroups. There are, however, context-specific reasons why alternative approaches may be adopted. Examples of various measurement criteria for common dimensions of inequality are provided below, with discussions of considerations for their categorization (i.e. how they are broken into subgroups) and the process of multiple disaggregation in the following subsections.
Measurement criteria for common dimensions of inequality
Dimensions of inequality can be measured using different criteria or classifications, which may be applied at individual, household or small-area levels. Decisions about how to measure dimensions of inequality should consider what is appropriate for the monitoring context, the intended purpose of monitoring, and what is nondiscriminatory and acceptable within the affected population. On a practical note, data availability and the specifications of data collection can be important factors when making decisions about the measurement of dimensions of inequality (considering the available data sources, and how information about dimensions of inequality were collected and recorded).
Demographic characteristics
Age may be measured as an absolute number in years or as a range of years. In the case of infants, age may be measured as days, weeks or months, as relevant. For preterm infants, gestational age (weeks of pregnancy completed) may be a relevant measure. For upper age bands, consideration is warranted regarding whether to use an open-ended top age group (e.g. adults aged 85 years or older). This may introduce bias in age standardization when comparing populations with different distributions of adults who are very old. Data sources that record date of birth present multiple options for how age is subsequently measured and categorized (15).
Recommendations for universal age groupings for reporting on health data have been suggested. Age groupings of five years for all health data are endorsed, except for children younger than five years, for whom finer disaggregation is recommended. Deviations may be warranted in certain circumstances, such as to account for statistical and methodological limitations. The widespread adoption of these recommendations would harmonize age-disaggregated data and enhance their usability and comparability across settings (15).
Sex refers to the “different biological and physiological characteristics of females, males and intersex persons, such as chromosomes, hormones and reproductive organs” (16). Sex is usually recorded at birth as female or male and is subsequently categorized as girl or boy, or woman or man. Data sources rarely distinguish between sex recorded at birth (as recorded on official documentation such as birth certificates) and self-reported sex. Increasingly, however, a distinction is drawn between sex assigned at birth and gender identity (referring to a deeply felt, internal and individual sense of one’s own identity with respect to gender).
Gender, which is a separate but related concept, refers to the socially constructed norms, stereotypes, roles, expressions and identities of boys, girls, men, women and gender-diverse people. As a social construct, the notion of gender varies between societies and can change over time. Several approaches to measuring gender have been proposed, which require contextual consideration (17, 18).
Socioeconomic characteristics
Economic status can be measured through direct measures such as income or consumption, or through proxy (also called indirect) measures such as assets, housing and access to services (noting that housing and access could also be used as indicators in their own right). Indices of economic status may be constructed using multiple direct and/or proxy measures. Direct and proxy measures of economic status have varying applicability in different contexts (see Annex 9). Wealth (or asset) indices have been used extensively as a measure of economic status, especially in low- and middle-income countries. Multicountry household surveys, such as the Demographic and Health Surveys (DHS), are particularly useful for constructing wealth indices because they contain harmonized data across countries (Box 17.2).
BOX 17.2. The Demographic and Health Surveys wealth index
The DHS wealth index can be constructed to determine the relative ranking of households in a country (19). It is based on asset ownership (e.g. televisions and bicycles), housing construction materials, and access to water and sanitation facilities. The wealth index is constructed at the national level and is based on principal component analysis. Because the DHS wealth index is a relative measure, it shows the economic position of the individual’s household in relation to other households in the country. Therefore, when DHS wealth indices are applied to assess and compare the extent of health inequalities across countries, they reflect the relative positions of richer versus poorer people within each country (which may not be comparable on an absolute scale).
Education is often measured as the number of years of education, the highest level of education attended, or the highest level of education completed. Standard requirements have been developed to classify educational activities. The International Standard Classification of Education, for example, lays out internationally agreed characteristics and definitions for nine levels of education spanning early childhood education to post-secondary levels of education (20). These levels are often aggregated into two or three broad categories (see Consider how the inequality dimension data were recorded below for more information).
Geographical characteristics
Place of residence classifications vary considerably depending on the context. What constitutes urban and rural may be determined through population concentration and density, administrative designations, sectoral employment (e.g. agriculture), or infrastructure and services. To enhance the international comparability of place of residence measurements for global monitoring, the United Nations Statistical Commission endorsed the Degree of Urbanization approach, which is a standard method to measure the urban–rural continuum (21). See Chapter 5 for more about health inequality monitoring in rural and remote settings.
Subnational regions of countries refer to the geographical areas defined by administrative divisions. There is variability across countries regarding the naming of administrative divisions and the number of levels of divisions. The most centralized administrative divisions (e.g. provinces or states) are termed first administrative level, which consist of second administrative level divisions (e.g. districts, municipalities or counties), and so on. In Europe, the Nomenclature of Territorial Units for Statistics (NUTS) classification is a hierarchical system for dividing territories into administrative levels for the purpose of collecting, developing and harmonizing European regional statistics (22). NUTS consists of three levels (NUTS 1, 2 and 3), defined in consideration of population thresholds and administrative divisions of Member States.
Deprivation indices
Deprivation indices are constructed using data reduction techniques (e.g. factor analysis) applied to data on multiple dimensions of inequality (e.g. income, employment, housing, crime, education, access to services and living environment) (23). Deprivation indices may be constructed at the level of the household or individual, but they are often measured at a small-area level (e.g. a census tract, electoral ward, postal code area or municipality). Inequality analyses sometimes entail ranking areas according to their deprivation index values and constructing groupings such as deciles or quintiles.
Several deprivation indices have been developed, spanning local, national and global applicability. For example, in the United States, a neighbourhood-level area deprivation index has extensive applications for health equity research, policy and community action. The index includes dimensions related to income, education, employment and housing quality, and data are visualized in the Neighborhood Atlas (24). As another example, the socioeconomic deprivation status (SDS) measure for monitoring health inequalities combines eight indicators across two domains – education (years of schooling and school attendance) and living standards (cooking fuel, sanitation, drinking water, electricity, housing and assets) (25). The SDS measure has been applied to measure inequalities in the coverage of reproductive and maternal health interventions in low- and middle-income countries and territories (26).
Categorizing dimensions of inequality
Categorizing dimensions of inequality involves deciding on the technical criteria for how population subgroups are formed (i.e. determining the number and composition of the subgroups). Health inequality monitoring requires data pertaining to at least two population subgroups per inequality dimension (Box 17.3). The categorization of dimensions of inequality is contingent upon how the dimension data were recorded or measured, limitations related to small sample sizes, and the intended purpose of the monitoring exercise. For example, explorations intending to characterize the gradient of inequality across economic groupings require more than two subgroups.
BOX 17.3. Binary, ordered and unordered dimensions of inequality
When a population is divided into two subgroups, the inequality dimension is described as binary. When the population is divided into more than two subgroups, the inequality dimension may be described as ordered (if the subgroups can be logically ranked, such as from poorest to richest) or unordered (if the subgroups have no natural ranking, such as subnational regions). The implications of binary or nonbinary inequality dimensions that are ordered or unordered are discussed further in Chapter 19-21 on summary measures of health inequality.
Consider how the inequality dimension data were recorded
The measurement of a given inequality dimension is a primary consideration for how it can be categorized into subgroups. A dimension of inequality that is measured with more granularity (i.e. with more detailed information) allows for a greater range of options for forming subgroups. For example, consider the categorization of education subgroups when education is measured as the highest level completed, and data correspond to six response options – less than primary school, primary school, secondary school, post-secondary diploma or certification, bachelor’s degree or equivalent, and postgraduate degree. Potential options for categorizing subgroups are shown in Figure 17.1. There are multiple options for categorizing the dimension as six or fewer subgroups – including options with the same number of subgroups but different composition (as demonstrated by options A and B for three subgroups). With the extent of available information in this example, however, it would not be possible to categorize education into more than six subgroups.
FIGURE 17.1. Categorizing education subgroups: selected examples of categories based on data with six responses
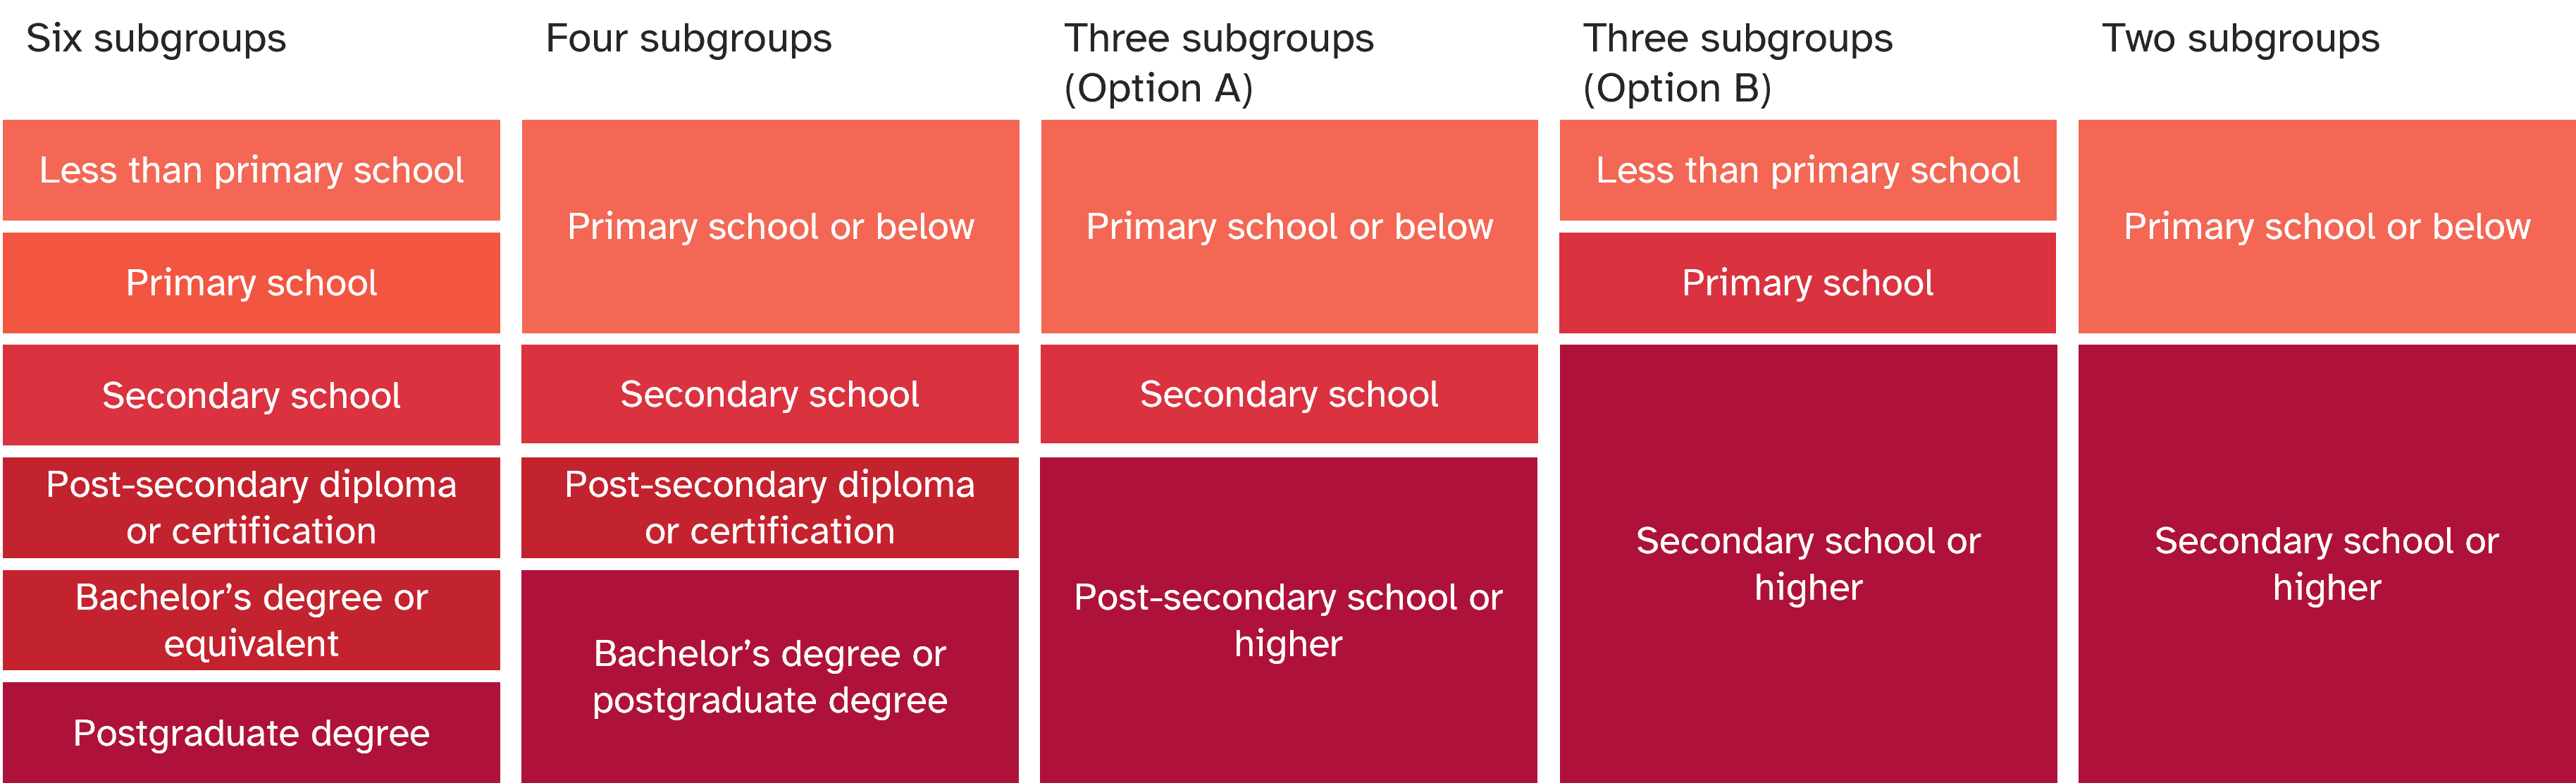
The examples shown in this figure do not represent all possible categorizations.
For dimensions of inequality recorded as continuous variables, subgroups may be constructed based on ranking and dividing the population into equally sized tertiles (three groups), quartiles (four groups), quintiles (five groups), deciles (10 groups), percentiles (100 groups), and so on. For example, monitoring of economic-based inequalities may compare health indicators between wealth quintiles (the poorest 20% versus the richest 20% of the population) or deciles (the poorest 10% versus the richest 10% of the population) (27). In this case, the determination of the number of subgroups entails consideration of resolution issues (see Chapter 18) and sample size (see below).
Sample size considerations
Sample size constitutes another important consideration when using certain data sources, such as household surveys or surveillance systems. The sample size of population subgroups is especially pertinent if the data source was originally designed to be representative of a larger population and not of smaller subgroups identified for inequality monitoring. If a population subgroup has a small sample size, the resulting estimate will be less reliable than a population subgroup with a large sample size. In some cases, small sample sizes may pose a risk to confidentiality, whereby individuals with unique or rare characteristics may be identifiable, especially if data files can be linked, merged or matched with other information sources. If no data are available for one or more subgroup, the possibilities for further inequality analysis are limited.
Sample size refers to the number of people on which the disaggregated (subgroup) estimate is based – that is, the denominator used to calculate a disaggregated estimate.
The categorization of dimensions of inequality can help to circumvent limitations posed by small sample size. Subgroups with low sample sizes can sometimes be combined with data from other response groups to form one subgroup that consequently has a larger sample size. Consider the categorization of education subgroups using household survey data. Although information may be collected about six education categories (see Figure 17.1), the sample size for certain responses may be very small. For example, in a population where the overall level of education is high, there may be only a few surveyed individuals who respond that their highest level of education was “less than primary school”. The estimate for this subgroup may therefore be unreliable, with a high degree of uncertainty. The “less than primary school” and “primary school” subgroups could be combined as “primary school or below”. This can help to generate estimates that are based on larger sample sizes and therefore are more reliable (although estimates are still subject to uncertainty and potential bias).
In some cases, however, it may not make sense to combine the response options, and therefore the response with the small sample may need to be flagged as “based on small sample size” for transparency or may need to be excluded from reported if the sample size is critically low (Box 17.4). Calculating the standard error or confidence intervals for disaggregated data estimates is helpful to show the reliability of estimates. The coefficient of variation (the ratio between the standard deviation and the mean) serves as another tool to flag estimates with low precision. In the literature, thresholds between 10% and 20% have been used, with estimates exceeding the specified threshold considered unreliable (30, 31).
In the longer term, the possibility of low sample size can be accounted for in the design of household surveys. If certain minority subgroups are especially relevant for monitoring, the survey sample design can be revisited to ensure oversampling of individuals from these groups (see Annex 8).
BOX 17.4. Thresholds for flagging or dropping estimates based on small sample sizes
Data sources follow different protocols regarding estimates based on small sample sizes. For example, the DHS Program requires estimates of intervention coverage based on sample sizes of 25–49 cases to be flagged. In general, estimates based on sample sizes of fewer than 25 cases are not reported (28). The WHO COVID-19 Detailed Surveillance Data Dashboard requires at least 100 cases for disaggregated data to be reported (29).
In Canada, COVID-19 mortality rates were reported based on numerators (numbers of deaths). For household or individual characteristics, such as dwelling, economic status or sex, rates based on death counts below 10 were suppressed. For small-area characteristics, such as concentration of people who are a visible minority or recently immigrated to Canada, rates based on death counts below five were suppressed (12).
Aligning with the monitoring purpose
The categorization of dimensions of inequality should aim to enhance the impact and relevance of monitoring. As with all aspects of health inequality monitoring, the categorization of dimensions of inequality should be informed by a detailed understanding of the health topic, affected population and monitoring context.
If inequality monitoring includes benchmarking of within-country inequality (comparing inequality across similar areas or populations) or tracking inequalities over time, the categorization of dimensions of inequality should be consistent to promote greater comparability. Although more precise data with greater granularity may be available for certain populations or time periods, aggregation may be required to ensure there are similar numbers and composition of subgroups across all populations. For example, the WHO Health Inequality Data Repository contains data about reproductive, maternal, newborn and child health indicators derived from household surveys, disaggregated by education (32). To enable meaningful comparisons across countries, education categorizations are made for three subgroups – “no education”, “primary education” and “secondary or higher education”. For certain countries, however, no data are reported for the “no education” category because the sample size is too small. A tailored analysis in such countries would be warranted for more relevant, context-specific explorations of education-related inequality.
Multiple disaggregation
Intersectionality is a concept originating in the social sciences, defined as the coexistence of multiple characteristics and identities that together compound disadvantage due to the interactions among them. Through double or multiple disaggregation, health inequality monitoring can serve as a starting point of exploring intersectionality.
Double disaggregation involves applying two dimensions of inequality simultaneously. Multiple disaggregation applies more than two dimensions.
For example, a health indicator may be disaggregated by place of residence to show the situation in rural versus urban areas. There may also, however, be important differences between the rich and poor populations within rural and urban areas, which could be explored through double disaggregation by both economic status and place of residence. This would yield data about priority populations such as rural poor populations and urban poor populations. Box 17.5 contains examples of double-disaggregated data pertaining to tobacco use.
BOX 17.5. Examples of double disaggregation
Figure 17.2 shows double disaggregation of the prevalence of smoking of any type of tobacco. Data for 50 countries are double disaggregated by economic status (wealth quintiles) and sex (female, male). There were distinct overall patterns of economic-related inequality in tobacco smoking among females and males. In males, the median values across countries show a stepwise gradient, with the highest prevalence in the poorest quintile (24.4%) and the lowest prevalence in the richest quintile (16.4%). In females, the median level of tobacco smoking prevalence is similarly low across all wealth quintiles (ranging from 1.1% to 1.3%).
FIGURE 17.2. Smoking any type of tobacco, by economic status, for females and males aged 15–49 years, in 50 countries
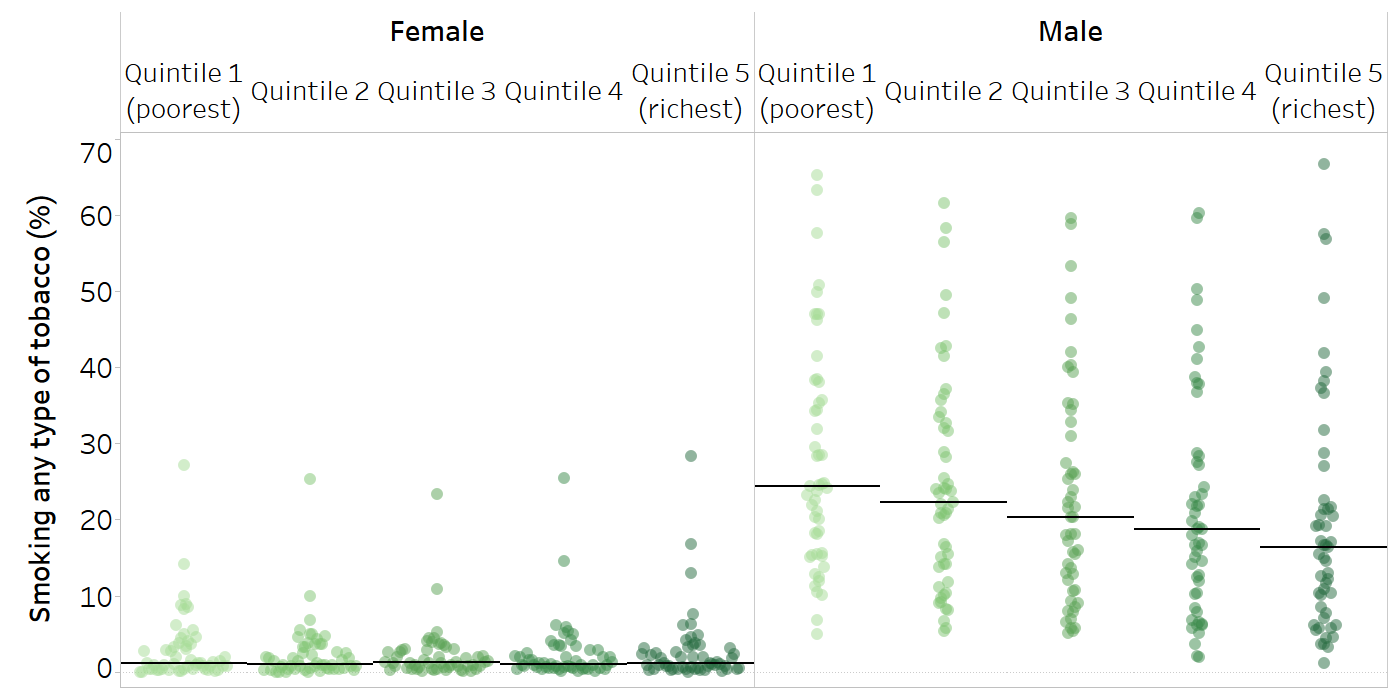
Each country is represented by multiple circles (one for each subgroup). Horizontal lines indicate the median across countries.
Source: derived from the WHO Health Inequality Data Repository Adult Health and Nutrition dataset (32), with data sourced from the most recent Demographic and Health Surveys between 2010 and 2021.
Figure 17.3 shows the pattern of economic-related inequality in females and males aged 15–49 years in Jordan, Papua New Guinea and Rwanda. Within each of these countries, the data reveal different patterns in females and males. In Jordan, economic-related inequality in tobacco smoking among females showed a pro-poor gradient, with lower prevalence among poorer quintiles. Among males in Jordan, nearly half smoked tobacco, with higher prevalence in poorer quintiles and lowest prevalence in the richest quintile. In Papua New Guinea, tobacco smoking in females showed a mixed pattern across wealth quintiles, with the highest prevalence in the richest and poorest quintiles. In males, prevalence was highest in the poorest quintile and lowest in the richest quintile. In Rwanda, there was no economic-related inequality in tobacco smoking in females, and the overall prevalence was low (0.9%). Males, by comparison, had higher smoking prevalence in the poorest quintile compared with the four richer quintiles.
FIGURE 17.3. Smoking any type of tobacco, by economic status, for females and males aged 15–49 years, three selected countries
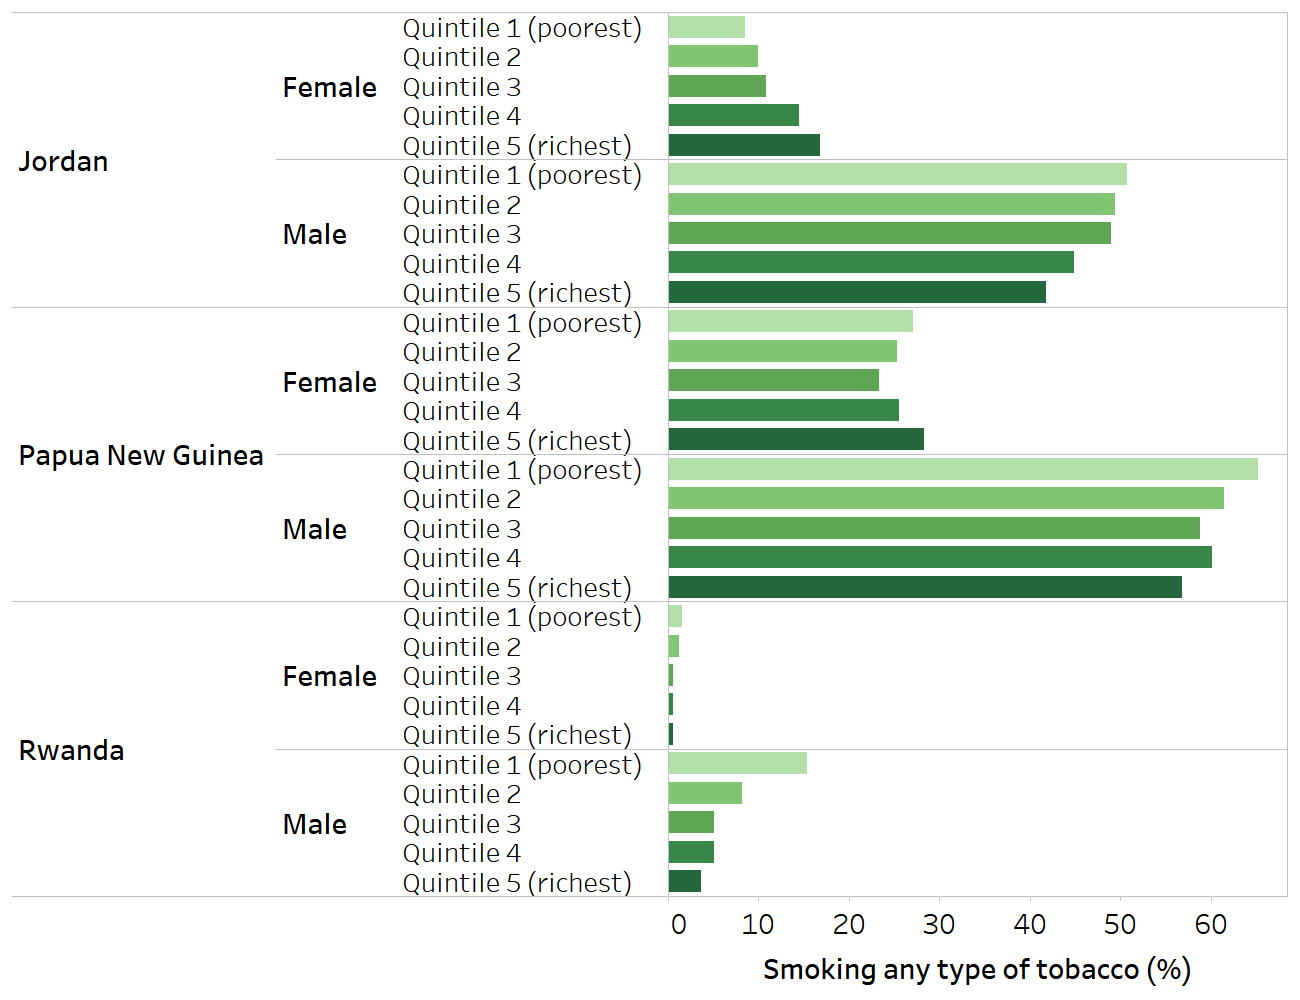
Source: derived from the WHO Health Inequality Data Repository Adult Health and Nutrition dataset (32), with data sourced from the Demographic and Health Surveys in 2017 (Jordan and Papua New Guinea) and 2019 (Rwanda).
The practice of multiple or double disaggregation is subject to the above considerations for measuring and categorizing dimensions of inequality. As data are disaggregated into increasingly smaller subgroups, however, sample size is more likely to become a limitation. In addition, as more forms of disadvantage are taken into account, the degree of inequality observed is likely to become larger – generating smaller and more numerous subgroups will capture more of the extreme aspects of the inequality dimension compared with fewer subgroups. See Chapter 18 for further discussion of resolution issues. Multiple regression analysis techniques, discussed in Chapter 25, provide other avenues for exploring the association between health and multiple dimensions of inequality.
Preparing data at individual, household or small-area levels
Health indicators and dimensions of inequality can be prepared at individual, household or small-area measurement levels – any of which can potentially be applied when analysing inequalities. Measures of individual characteristics (e.g. use of a health service or education attainment) can be summarized at the small-area level (e.g. district-level health service coverage or average education level in a district). A scoping review of inequalities in COVID-19 vaccination demonstrated how articles presented vaccination coverage data at the level of individuals (percentage vaccinated), small areas (including percentage vaccinated by county, municipality, postal code area, province, state or census area), and institutions (including percentage vaccinated by nursing home or school) (33). The vaccination coverage data were then disaggregated by various inequality dimensions, which were usually (but not always) measured at the same level as the corresponding COVID-19 vaccination indicator (see examples in Table 17.1).
Table 17.1. Examples of assessing inequality in COVID-19 vaccination coverage using data prepared at individual and small-area levels
| Concept | Health indicator example | Inequality dimension example | Disaggregation |
|---|---|---|---|
| Individual-level health indicator and dimension of inequality data | Receipt of COVID-19 vaccine by individual | Education level of individual | Percentage of vaccinated individuals across different levels of education |
| Individual-level health indicator data and small-area-level dimension of inequality data | Delayed or missed COVID-19 vaccine by individual | Area-level social vulnerability index score | Percentage of individuals who delayed or missed a COVID-19 vaccine dose in areas with high, medium or low social vulnerability index score |
| Small-area-level health indicator and dimension of inequality data | Neighbourhood-level rate of vaccination | Social vulnerability index of municipality | Percentage of neighbourhoods that received vaccination by social vulnerability index of municipality |
Source: examples are drawn from articles included in a scoping review of within-country inequality in COVID-19 vaccination coverage (33-36).
The choice of level at which to prepare the data carries certain assumptions and should align with the purpose of the monitoring exercise. For example, in many applications of inequality monitoring, economic status is expressed at the household level, with the implicit assumption that income or assets are shared among household members. Individual-level data disaggregated by economic status would answer different questions about inequality than comparisons based on the economic status of a municipality. This decision also depends in part on the data source. Household surveys collect information from individuals and households, and thus tend to be suited for preparation at the individual or household level. Censuses, on the other hand, may be limited to household- or area-based levels of analysis. Data sources that contain information about small-area identifiers can sometimes be linked, enabling preparation at that level.
In cases where data at the individual or household level are limited, the use of data at the small-area level may enable an expanded scope of inequality monitoring, drawing from a wider selection of data sources. In some countries, deprivation indices have been developed and applied at the level of census tracts, electoral wards, postal code areas or municipalities (see Deprivation indices above). Care is required when presenting and interpreting dimensions of inequality measured at the small-area level, because area-level data do not reflect the situation for all individuals within that area. See Chapter 18 for more on ecological fallacy.
References
1. Training. Geneva: World Health Organization (https://www.who.int/data/inequality-monitor/training, accessed 4 September 2024).
2. Statistical codes for health inequality analysis. Geneva: World Health Organization (https://www.who.int/data/inequality-monitor/tools-resources/statistical_codes, accessed 28 May 2024).
3. Victora CG, Boerma T. Inequalities in child mortality: real data or modelled estimates? Lancet Glob Health. 2018;6(5):e477–e478. doi:10.1016/S2214-109X(18)30109-8.
4. Global indicator framework for the Sustainable Development Goals and targets of the 2030 Agenda for Sustainable Development. New York: United Nations Department of Economic and Social Affairs (https://unstats.un.org/sdgs/indicators/indicators-list/, accessed 28 May 2024).
5. 2018 global reference list of 100 core health indicators (plus health-related SDGs). Geneva: World Health Organization; 2018 (https://iris.who.int/handle/10665/259951, accessed 28 May 2024).
6. Barclay M, Dixon-Woods M, Lyratzopoulos G. The problem with complex indicators. BMJ Qual Saf. 2019;28:338–344. doi:10.1136/bmjqs-2018-007798.
7. Organisation for Economic Co-operation and Development, European Union, European Commission Joint Research Centre. Handbook on constructing composite indicators: methodology and user guide. Paris: Organisation for Economic Co-operation and Development; 2008 (https://www.oecd-ilibrary.org/economics/handbook-on-constructing-composite-indicators-methodology-and-user-guide_9789264043466-en, accessed 20 June 2024).
8. Hogan DR, Stevens GA, Hosseinpoor AR, Boerma T. Monitoring universal health coverage within the Sustainable Development Goals: development and baseline data for an index of essential health services. Lancet Glob Health. 2018;6(2):e152–e168. doi:10.1016/S2214-109X(17)30472-2.
9. Wehrmeister FC, Barros AJD, Hosseinpoor AR, Boerma T, Victora CG. Measuring universal health coverage in reproductive, maternal, newborn and child health: an update of the composite coverage index. PLoS One. 2020;15(4):e0232350. doi:10.1371/journal.pone.0232350.
10. Ewerling F, Raj A, Victora CG, Hellwig F, Coll CV, Barros AJ. SWPER Global: a survey-based women’s empowerment index expanded from Africa to all low- and middle-income countries. J Glob Health. 2020;10(2):020343. doi:10.7189/jogh.10.020434.
11. Global health estimates. Geneva: World Health Organization (https://www.who.int/data/global-health-estimates, accessed 28 May 2024).
12. Social inequalities in COVID-19 mortality by area- and individual-level characteristics in Canada, January 2020 to December 2020/March 2021. Ottawa: Public Health Agency of Canada; 2022 (https://health-infobase.canada.ca/covid-19/inequalities-deaths/technical-report.html#t5, accessed 28 May 2024).
13. Canadian vital statistics - death database (CVSD). Ottawa: Statistics Canada (https://www23.statcan.gc.ca/imdb/p2SV.pl?Function=getSurvey&SDDS=3233, accessed 27 June 2024).
14. Bruckhaus AA, Abedi A, Salehi S, Pickering TA, Zhang Y, Martinez A, et al. COVID-19 vaccination dynamics in the US: coverage velocity and carrying capacity based on socio-demographic vulnerability indices in California. J Immigr Minor Health. 2022;24(1):18–30. doi:10.1007/s10903-021-01308-2.
15. Diaz T, Strong KL, Cao B, Guthold R, Moran AC, Moller AB, et al. A call for standardised age-disaggregated health data. Lancet Healthy Longev. 2021;2(7):e436–e443. doi:10.1016/S2666-7568(21)00115-X.
16. Gender and health. Geneva: World Health Organization (https://www.who.int/health-topics/gender, accessed 28 May 2024).
17. Lindqvist A, Sendén MG, Renström EA. What is gender, anyway: a review of the options for operationalising gender. Psychol Sex. 2021;12(4):332–344. doi:10.1080/19419899.2020.1729844.
18. Committee on Measuring Sex, Gender Identity, and Sexual Orientation. Measuring sex, gender identity, and sexual orientation. Washington, DC: National Academies Press; 2022 (https://nap.nationalacademies.org/resource/26424/Issue_Brief_Identity&Transgender_Experience.pdf, accessed 28 May 2024).
19. DHS Program. Wealth index. Washington, DC: United States Agency for International Development (https://dhsprogram.com/topics/wealth-index/, accessed 28 May 2024).
20. International standard classification of education (ISCED) 2011. Montreal: UNESCO Institute for Statistics; 2012 (https://uis.unesco.org/sites/default/files/documents/international-standard-classification-of-education-isced-2011-en.pdf, accessed 28 May 2024).
21. Dijkstra L, Hamilton E, Lall S, Wahba S. How do we define cities, towns, and rural areas? Washington, DC: World Bank; 2020 (https://blogs.worldbank.org/sustainablecities/how-do-we-define-cities-towns-and-rural-areas, accessed 28 May 2024).
22. NUTS: nomenclature of territorial units for statistics. Luxembourg: Eurostat (https://ec.europa.eu/eurostat/web/nuts/overview, accessed 28 May 2024).
23. Allik M, Leyland A, Travassos Ichihara MY, Dundas R. Creating small-area deprivation indices: a guide for stages and options. J Epidemiol Community Health. 2020;74(1):20–25. doi:10.1136/jech-2019-213255.
24. Neighborhood Atlas. Madison, WI: Center for Health Disparities Research, University of Wisconsin (https://www.neighborhoodatlas.medicine.wisc.edu/, accessed 28 May 2024).
25. Dirksen J, Pinilla-Roncancio M, Wehrmeister FC, Ferreira LZ, Vidaletti LP, Kirkby K, et al. Exploring the potential for a new measure of socioeconomic deprivation status to monitor health inequality. Int J Equity Health. 2022;21(1):56. doi:10.1186/s12939-022-01661-0.
26. Ferreira LZ, Wehrmeister FC, Dirksen J, Vidaletti LP, Pinilla-Roncancio M, Kirkby K, et al. A composite index: socioeconomic deprivation and coverage of reproductive and maternal health interventions. Bull World Health Organ. 2024;102(2):105–116. doi:10.2471/BLT.23.290866.
27. Wong KLM, Restrepo-Méndez MC, Barros AJD, Victora CG. Socioeconomic inequalities in skilled birth attendance and child stunting in selected low and middle income countries: wealth quintiles or deciles? PLoS One. 2017;12(5):e0174823. doi:10.1371/journal.pone.0174823.
28. Pedersen J, Liu J. Child mortality estimation: appropriate time periods for child mortality estimates from full birth histories. PLoS Med. 2012;9(8):e1001289. doi:10.1371/journal.pmed.1001289.
29. Victora CG, Barros AJD, Blumenberg C, Costa JC, Vidaletti LP, Wehrmeister FC, et al. Association between ethnicity and under-5 mortality: analysis of data from demographic surveys from 36 low-income and middle-income countries. Lancet Glob Health. 2020;8(3):e352–e361. doi:10.1016/S2214-109X(20)30025-5.
30. Croft T, Marshall AMJ, Allen CK. Guide to DHS statistics. Rockville, MD: ICF; 2018 (https://dhsprogram.com/data/Guide-to-DHS-Statistics/index.htm#t=Guide_to_DHS_Statistics_DHS-8.htm, accessed 11 June 2024).
31. WHO COVID-19 detailed surveillance data dashboard. Geneva: World Health Organization (https://app.powerbi.com/view?r=eyJrIjoiY2UyNmQ0MWQtYjdiZC00MmIyLWI5YmYtZmRiZWJkZDcyMDMwIiwidCI6ImY2MTBjMGI3LWJkMjQtNGIzOS04MTBiLTNkYzI4MGFmYjU5MCIsImMiOjh9, accessed 17 June 2024).
32. Health Inequality Data Repository. Geneva: World Health Organization (https://www.who.int/data/inequality-monitor/data, accessed 15 May 2024).
33. Bergen N, Johns NE, Chang Blanc D, Hosseinpoor AR. Within-country inequality in COVID-19 vaccination coverage: a scoping review of academic literature. Vaccines (Basel). 2023;11(3):517. doi:10.3390/vaccines11030517.
34. Buscemi J, Arteaga N, O’Donnell A, Takgbajouah M, Bushnell A, Mirich C, et al. Factors associated with COVID-19 vaccination uptake in community health center patients. Health Psychol. 2023;42(8):551–226. doi:10.1037/hea0001241.
35. Meng L, Murthy NC, Murthy BP, Zell E, Saelee R, Irving M, et al. Factors associated with delayed or missed second-dose mRNA COVID-19 vaccination among persons >12 years of age, United States. Emerg Infect Dis. 2022;28(8):1633–1641. doi:10.3201/eid2808.220557.
36. Bilal U, Mullachery PH, Schnake-Mahl A, Rollins H, McCulley E, Kolker J, et al. Heterogeneity in spatial inequities in COVID-19 vaccination across 16 large US cities. Am J Epidemiol. 2022;191(9):1546–1556. doi:10.1093/aje/kwac076.