Chapter 1. What are health inequalities and why monitor them?
Overview
Health inequalities are measurable differences in health or the determinants of health between population subgroups, which may be defined according to characteristics such as age, economic status, education level, place of residence, sex or subnational region. Health inequalities can be measured and monitored over time using data. They can be measured between countries or groups of countries, or between population subgroups within a country. Interpreted literally, “health inequalities” refers to any health differences among any individuals; for the past three decades, however, the term has been used globally to refer to differences linked to social advantage or disadvantage.
Health inequalities exist in diverse aspects of health, well-being and access to good-quality health services. They may reflect different forms of disadvantage. For example, children in lower-income countries are more likely to be unvaccinated or under-vaccinated than children in higher-income countries. As another example, within many countries, people from wealthier households are more likely to access essential health services than people from poorer households.
Characterizing and monitoring health inequalities is a first step towards assessing whether a particular situation is considered fair and acceptable or should be flagged for remedial action. In this way, evaluating health inequality is integral to the advancement of health equity – or the absence of unfair, avoidable or remediable differences in health.
This chapter explores the concepts of health inequality and health equity and introduces the general applications of health inequality monitoring. It considers the following questions: How is health inequality related to and distinct from the notion of health equity? What do health inequalities reveal about the state of population health? How can monitoring health inequality be part of creating more equitable societies? And why does this matter?
The objective of this chapter is to showcase the importance of health inequality monitoring and its functions within the broader goal of advancing health equity. After looking at how inequality data (i.e. disaggregated data) can expose patterns masked by overall averages, the chapter introduces and differentiates between the concepts of health inequality and health inequity. It then describes core functions of inequality monitoring.
Looking beyond averages
Health information is often communicated by summarizing the situation across the entire population. The mean (average) and median (middle value) are ways to measure the overall level of health in a population. Dispersion provides information about the distribution of health in a population (Box 1.1). Such measures, however, do not show how health varies between subgroups of the population. Assessments of health inequality, which are derived from disaggregated health data, provide more detailed information by accounting for the situation in population subgroups.
Disaggregated health data are data on health or determinants of health, by population subgroups defined by one or more characteristics such as age, economic status, education level, place of residence, sex or subnational region. Disaggregated data can show underlying inequality patterns that are not evident from overall averages across a population.
BOX 1.1. Measures of dispersion
Measures of dispersion demonstrate the distribution of a health indicator among individuals in a population. These measures are described as univariate because they consider only one variable (health) and do not consider social groupings or positioning. (By contrast, bivariate measures of health inequality require information about a health variable and a relevant dimension of inequality.) Measures of dispersion include standard deviation, variance and the Gini index (see Chapter 25).
To see what can be derived by looking beyond overall averages, consider the following examples, which illustrate measles immunization coverage in Thailand, childhood stunting in Ghana, and the primary reliance on clean fuels and technologies for cooking in different regions of the world.
Overall, 87% of children in Thailand received two doses of measles-containing vaccine in 2019 (Figure 1.1, Panel A). This map of national average data makes it seem like measles immunization is spread evenly across the country. The map in Panel B, however, reveals variation in coverage across provinces. The disaggregated data demonstrate there are several provinces where almost all children are vaccinated and other provinces with coverage below 80% (1). Given that childhood immunization is essential to the reduction of mortality among children aged under five years and disease eradication and elimination, the disaggregated data in Thailand suggest a need for further effective targeting of immunization interventions to regions where coverage is low.
FIGURE 1.1. Measles-containing vaccine second-dose immunization coverage, Thailand
.png)
.png)
Source: World Health Organization Regional Office for South-East Asia (1), with data from 2019 sourced from the WHO South-East Asia Region annual Expanded Programme on Immunization reporting.
Another example can be drawn from data about childhood stunting in Ghana. Stunting in childhood indicates impaired growth and development caused by poor nutrition, repeated infection, chronic diseases and inadequate psychosocial stimulation (2). It is measured in children using data about height-for-age.
Across the entire population of the country, there is variation in height-for-age among children aged under five years, which can be assessed by considering dispersion (Figure 1.2, Panel A). This does not, however, show inequality in stunting between subgroups within the population.
Inequality in childhood stunting can be measured by disaggregating the population into subgroups based on their relative household wealth and comparing the proportion of stunted children – measured using the threshold of height-for-age more than two standard deviations below the WHO Child Growth Standards median (2) – between the poorest and richest subgroups (Figure 1.2, Panel B). These data demonstrate large gaps between the richest and poorest children in 2003 and 2022, with higher prevalence of stunting in the poorest quintile compared with the richest quintile. The gap between the richest and the poorest (in absolute terms) was smaller in 2022 compared with 2003 (3).
FIGURE 1.2. Prevalence of stunting in children aged under five years, by economic status, Ghana
.png)
.png)
In panel B, stunting measured as height-for-age more than two standard deviations below the WHO Child Growth Standards median (2).
Source: derived from the WHO Health Inequality Data Repository Child Malnutrition dataset (3), with data from the 2003 and 2022 Demographic and Health Surveys.
A final example considers inequality in the primary reliance on clean fuels and technologies (e.g. electricity, natural gas, liquified petroleum gas, biogas, ethanol, solar) for cooking. This has emerged as a global concern due to the established negative health impacts of using unclean fuels, including respiratory, eye, cardiovascular and metabolic issues. Globally, household air pollution caused 3.2 million premature deaths per year in 2019 (4).
Overall, 73.6% of people cook using clean fuels and technologies, ranging from 23.8% in Africa to 96.8% in Europe (Figure 1.3, Panel A). Across all regions of the world, people living in rural areas are less likely to use clean fuels and technologies for cooking than people living in urban areas (Panel B). This difference is most pronounced in Africa, where cleaner technologies are used for cooking by only 8.2% of people in rural areas, compared with 44.7% of people in urban areas (5).
FIGURE 1.3. Proportion of people with primary reliance on clean fuels and technologies for cooking, globally and by WHO region
.png)
.png)
Source: derived from the WHO Global Health Observatory (5), with data from 2022.
These data indicate a need for strategies to promote clean cooking and address barriers to using clean fuels and technologies, targeted particularly at rural areas. Such strategies can improve health and also mitigate climate change. Since household energy use is a cross-cutting issue, designing and implementing ways to improve it involves collaboration across multiple sectors, including energy, environment, finance, food and agriculture, health, land and natural resources, science and technology, and trade and industry.
Health inequality and health inequity
From the WHO perspective, health inequality is distinct from – but related to – the concepts of health inequity and health equity (6). Health inequalities are observed differences in health between population subgroups formed on the basis of dimensions of inequality (Box 1.2). Health inequities refer to unfair, avoidable or remediable differences in health among groups of people. Health equity – or the absence of health inequity – is achieved when every individual and population group has a fair chance of attaining their full potential for health and well-being (7).
BOX 1.2. Dimensions of inequality
Dimensions of inequality are the criteria upon which population subgroups are defined for inequality monitoring. Dimensions of inequality encompass demographic, socioeconomic and geographic characteristics. Some examples of dimensions of inequality that are commonly applied in health inequality monitoring include age, economic status, education level, place of residence, sex and subnational region.
The selection of dimensions of inequality for health inequality monitoring is discussed in Chapter 3, and their measurement and categorization are addressed in Chapter 17.
Authors across various contexts use terminology related to health inequality, health inequity and health equity – or other terms, such as health disparity – to signify and emphasize different points. In some contexts, health disparity, health inequality and health inequity may carry the same meaning and be used interchangeably (8). Generally, however, health inequality and health disparity are more appropriate to use in a measurement context; they refer to differences associated with social disadvantage (9). Health inequity, by contrast, is explicit about the presence of injustice. See Box 1.3 for more on the conceptual difference between health inequality and other forms of inequality.
Why is it important to differentiate between health inequality and health inequity? A common understanding of these terms – including how they overlap and how they are different – allows for a more nuanced engagement with the contents of this book. Clarity around these key concepts facilitates greater precision and intentionality when designing, implementing and interpreting health inequality monitoring activities.
BOX 1.3: Health inequality and other forms of inequality
Health inequalities are conceptually distinct from other forms of social and economic inequality, such as gender inequality, income inequality and racial inequality.
Health inequalities are defined by a dimension of inequality – that is, health data are compared across population subgroups. For example, when examining education as a determinant of inequality, health inequalities may be described as “education-related inequalities in health” or “inequalities in health according to education”.
Other forms of economic or social inequality denote unequal access to resources, opportunities, capacities and freedoms. Income inequality, for example, might describe how income is distributed unevenly within a population. Gender inequality and racial inequality refer to unequal capacities and opportunities to access and control all social, economic and political resources (e.g. health services, education, voting rights).
Although there may be debate about whether health inequalities are determined as inequitable or not, social inequalities are by their very nature unjustifiable, because they refer to access to opportunities, capacities and freedoms.
Defining “inequitable”
Differences in health between population groups – health inequalities – are considered inequitable when they are unfair, avoidable or remediable through reasonable actions. Fairness describes circumstances deemed to be right, reasonable and free from discrimination. (Justice and fairness are similar, but justice carries a more explicit connotation of social justice – that is, concern for groups that have been marginalized or excluded in the past.) The word “avoidable” refers to that which can be reasonably prevented, while “remediable” denotes a condition that could be rectified (even if it may be difficult to avoid).
A key characteristic of health inequities is that they are subject to interpretation and value judgements because they involve discerning whether a difference in health is unfair, avoidable or remediable (9). People may hold different opinions about what is considered fair, avoidable or remediable through reasonable actions (10). In contrast, health inequalities are not necessarily subject to this same type of interpretation, although there may be differing views related to the underlying data and measurement approaches. See Chapter 22 for more on how technical decisions regarding measurement approaches convey value judgements.
Measuring health inequalities is part of monitoring progress towards achieving health equity.
Health inequities are a result of the decision-making processes, policies, social norms and structures that exist at all levels in society (11). They go hand in hand with disadvantages that are socially produced, such as social exclusion, poverty, discrimination, and limited access to public services or goods. As part of human rights commitments, states have an obligation to ensure access to health services that are available, accessible, acceptable and of good quality. States must remove obstacles to some of the underlying determinants of health, such as safe and potable water, sanitation, food, housing, health-related information and education, and information about health problems affecting an individual’s community. See Chapter 10 for more on human rights as a foundation for health equity.
The right to health is a basic human right. Everyone must have access to the health services they need, when and where they need them, and without financial hardship.
Measuring health inequalities provides a starting point for exploring health inequities by quantifying indicators of health across population subgroups. Differences in health often indicate a potential situation of inequity, but in some cases the absence of a difference between groups – a situation of equality – may be considered inequitable. For example, the equal distribution of preventive health services may be considered unfair if one subgroup has higher needs than another. Box 1.4 provides an example of how a situation of equality pertaining to a malaria control indicator may be considered inequitable.
BOX 1.4. When is equality inequitable?
If two groups experience different levels of disease risk, the equal distribution of a prevention measure may be considered inequitable. Insecticide-treated nets (ITNs) are one of the main vector control measures recommended by the WHO Global Malaria Programme (12). The deployment of ITNs is applicable for all populations at risk of malaria in most epidemiological and ecological settings. A programme evaluation might entail measuring and comparing the per capita distribution of ITNs in rural versus urban areas (as depicted in a hypothetical illustration in Figure 1.4). Suppose the data show that the per capita distribution is about the same in both places of residence (Panel A). This is a situation demonstrating no inequality in per capita ITN distribution.
A consideration of health equity, however, might account for the different risk of malaria in the two places of residence. The transmission of malaria is generally lower in urban areas than rural areas (13) (as depicted in Figure 1.4, Panel B). Therefore, one perspective might argue that an equal distribution (Panel A) is unfair because the need for ITNs (and their potential impact on public health outcomes) is greater in rural areas. According to this perspective, an approach rooted in health equity would entail distributing ITNs unequally (Panel B), with greater per capita distribution in rural areas, resulting in a more equitable distribution that favours the rural population.
FIGURE 1.4. Hypothetical illustration of per capita distribution of insecticide-treated nets (ITNs) in rural and urban areas
.png)
.png)
Core functions of health inequality monitoring
Monitoring is the process of repeatedly making observations of a situation to look for changes over time. The overarching purpose of monitoring health inequalities is to inform the implementation of changes that advance health equity and improve the health of all people, including people from populations facing disadvantage. Inequality monitoring may be conducted as part of evaluation processes and should be embedded in health information systems (see Chapter 6).
Evaluation is a process that attempts to determine as systematically and objectively as possible the relevance, effectiveness and impact of activities in light of their objectives (14).
When undertaken regularly, health inequality monitoring can help to identify population subgroups that experience poorer health and lower access to health services. It can serve to determine which groups benefit from policies, programmes and practices, and which groups may be missing out on the benefits of – or experiencing worsening health due to – existing or new interventions (e.g. removal or reduction of social protection measures). Health inequality monitoring can also help to inform actions to improve the health of people experiencing the most disadvantage and the population overall and enhance accountability for these actions.
Inequality monitoring as a warning system
Taking into account the variable level of health across population subgroups, health inequality monitoring serves as a warning system for identifying and acting upon situations of health inequity. It helps to ascertain which dimensions of inequality are relevant to a particular aspect of health (see Chapter 18 for information on technical considerations for comparing inequalities based on different dimensions of inequality). For example, are differences in health observed between people with higher versus lower levels of education, rural versus urban residents, or the richest versus the poorest households? Health inequality monitoring can provide information about the direction of inequality, showing which subgroup has better or worse health. Further, it gives a sense of the extent of the inequality – that is, the magnitude of the difference between subgroups.
As an example, Figure 1.5 illustrates the coverage of reproductive, maternal, newborn and child health interventions, measured using the composite coverage index across various dimensions of inequality. The data, which reflect the status of inequality between 2012 and 2021, suggest higher coverage across richer and more educated subgroups, and higher coverage in urban compared with rural areas.
FIGURE 1.5. Reproductive, maternal, newborn and child health composite coverage index, by multiple dimensions of inequality, 21 low-income countries
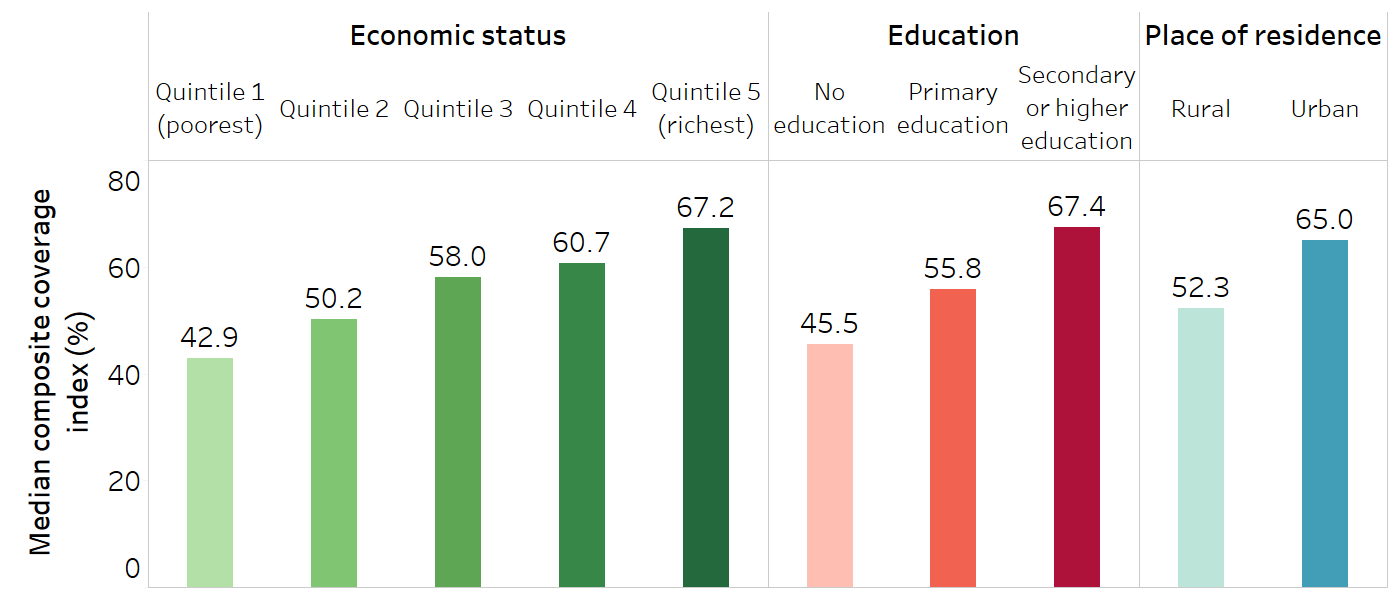
The reproductive, maternal, newborn and child health composite coverage index is a weighted score of the coverage of eight interventions: demand for family planning satisfied (modern methods); antenatal care coverage (at least four visits); births attended by skilled health personnel; Bacillus Calmette–Guérin (BCG) immunization coverage among children aged one year; measles immunization coverage among children aged one year; immunization coverage with a third dose of the diphtheria, tetanus toxoid and pertussis vaccine (DTP3) among children aged one year; children aged under five years with diarrhoea receiving oral rehydration therapy and continued feeding; and children aged under five years with pneumonia symptoms taken to a health facility (15).
Source: derived from the WHO Health Inequality Data Repository Reproductive, Maternal, Newborn and Child Health dataset (3), with data sourced from the most recent Demographic and Health Survey or Multiple Indicator Cluster Survey between 2012 and 2021.
When health inequality monitoring is repeated over time, it reveals trends in inequalities, showing how inequalities have increased or narrowed. These trends can be interpreted alongside population-level averages to generate insight into whether the situation is improving, staying the same or getting worse (Box 1.5). Evaluating trends in inequality over time can help to determine the impact of policies, programmes and practices, and to start to understand whether they are having their intended effect. It can serve as one form of evidence to inform where changes are necessary to further reduce inequality.
Inequality monitoring should be part of health-sector plans and strategies to promote regular monitoring and continued improvement from baseline measures towards targets (see Chapter 6).
BOX 1.5. Trends in inequality over time
In general, a situation of overall improving population-level health alongside narrowing inequalities tends to indicate a desirable trend. This would be the case, for instance, if a country reported overall improved health service coverage over a 10-year period, with faster increases in coverage in disadvantaged rural areas compared with urban areas.
Conversely, the least desirable situation would be declining population-level health alongside widening inequalities. This would occur, for example, if there were decreased overall national coverage of health services, with sharper declines in rural areas compared with urban areas. For more on evaluating scenarios with various trends in overall health and inequality, see Chapter 22.
Building on the previous example of inequality in reproductive, maternal, newborn and child health composite coverage index, Figure 1.6 illustrates how economic-related, education-related and place of residence inequality in 2012–2021 compared with the previous decade. Between these two time periods, coverage increased in all subgroups across the three dimensions of inequality, while the gaps between the most and least advantaged subgroups narrowed.
FIGURE 1.6. Reproductive, maternal, newborn and child health composite coverage index, by multiple dimensions of inequality, 17 low-income countries: change over time
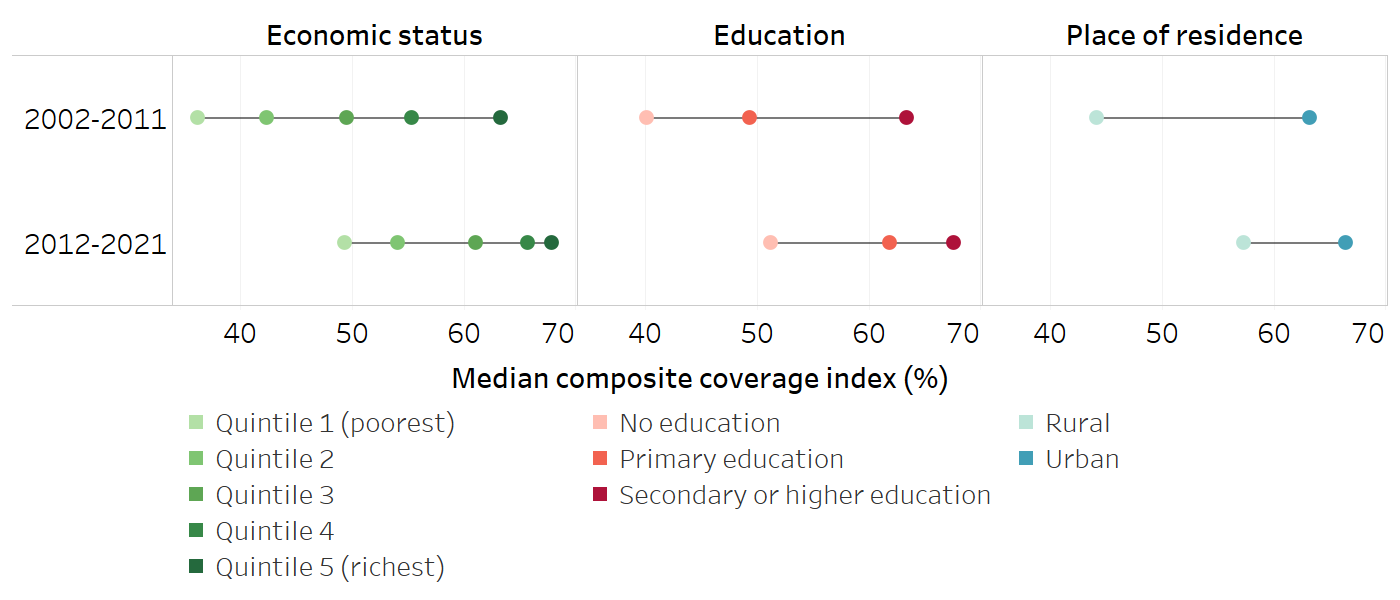
Horizontal lines show the range between the lowest and highest subgroup estimates.
The reproductive, maternal, newborn and child health composite coverage index is a weighted score of the coverage of eight interventions: demand for family planning satisfied (modern methods); antenatal care coverage (at least four visits); births attended by skilled health personnel; Bacillus Calmette–Guérin (BCG) immunization coverage among children aged one year; measles immunization coverage among children aged one year; immunization coverage with a third dose of the diphtheria, tetanus toxoid and pertussis vaccine (DTP3) among children aged one year; children aged under five years with diarrhoea receiving oral rehydration therapy and continued feeding; and children aged under five years with pneumonia symptoms taken to a health facility (15).
Source: derived from the WHO Health Inequality Data Repository Reproductive, Maternal, Newborn and Child Health dataset (3), with data sourced from Demographic and Health Survey or Multiple Indicator Cluster Survey between 2002 and 2011 and between 2012 and 2021.
Inequality monitoring to strengthen equity-oriented interventions
Equity-oriented interventions for health are designed to achieve the highest possible standard of health for all people, with special attention paid to the needs of people at greatest risk of poor health (11). In the health sector, this means that all people everywhere should have timely access to high-quality, acceptable and effective services (7).
Health inequality monitoring provides evidence to help inform equity-oriented actions and programmes. Together with other forms of evidence, this can aid in the efficient and equitable allocation of resources. This approach not only targets disadvantaged groups but also enhances overall population health by reducing health inequities. Box 1.6 illustrates how inequality monitoring was used to inform and strengthen equity-oriented HIV testing service delivery in Bulgaria. For more information about leveraging health inequality monitoring to generate impact, see Part 2.
BOX 1.6. Equity-oriented responses to address HIV prevalence in key populations in Bulgaria
The following example was adapted from the Compendium of good practices in the health sector response to HIV in the WHO European Region (16).
Although the overall HIV prevalence in Bulgaria is low (<0.1% among adults aged 15 and older in 2023), disaggregated data demonstrate higher prevalence in certain key population subgroups. For example, as of 2023, HIV prevalence was 2.5% among people who inject drugs, and 6.2% among men who have sex with men (17).
Prior to 2001, a particular challenge among key populations was low coverage of HIV testing services (16). Beginning in 2001, HIV testing services, available to the general public through health-care facilities, were expanded to enable greater accessibility for people from key populations. This was pursued by building a network of low-threshold testing service sites. A variety of approaches was used, including on-site HIV rapid tests via mobile medical units in drop-in centres used by people from the target populations and difficult-to-reach places. HIV testing services were also established in prisons and near popular seasonal resorts.
Ongoing monitoring across these key populations has shown remarkable increases in the number of people receiving HIV testing services between 2001 and 2015, including a 40-fold increase between 2003 and 2009 (16).
Inequality monitoring to enhance accountability
One way that inequality monitoring supports the success of equity-oriented policies, programmes and practices is through enhanced accountability. In this context, accountability refers to the responsibility of individuals, organizations, institutions and societies to uphold their commitments to actions that advance health equity. By integrating health inequality targets and indicators into core health priorities and accountability mechanisms, monitoring can be used to track and drive progress towards achieving equity goals. When information about health inequalities is reported in a transparent and public manner, there may be increased awareness and demand for remedial action.
For example, equity is reflected in global efforts to expand immunization coverage. The Immunization Agenda 2030 emphasizes the use of data to track coverage by age, gender, location and socioeconomic status, and includes an indicator of immunization coverage in the 20% of districts with the lowest coverage (18). The implementation of the Agenda is supported through a global-level partnership model for ownership and accountability, which involves technical advisory bodies through an independent review of monitoring results, and reporting to the World Health Assembly (19). Communities and civil society organizations are also part of holding national and subnational authorities accountable for the equitable delivery of immunization services (18).
References
1. Thailand factsheet 2020: Expanded Programme on Immunization (EPI). Bangkok: World Health Organization Regional Office for South-East Asia; 2020 (https://iris.who.int/handle/10665/336764, accessed 23 September 2024).
2. Stunting in a nutshell. Geneva: World Health Organization; 2015 (https://www.who.int/news/item/19-11-2015-stunting-in-a-nutshell, accessed 10 June 2024).
3. Health Inequality Data Repository. Geneva: World Health Organization (https://www.who.int/data/inequality-monitor/data, accessed 20 June 2024).
4. Household air pollution. Geneva: World Health Organization; 2023 (https://www.who.int/news-room/fact-sheets/detail/household-air-pollution-and-health, accessed 10 July 2024).
5. Global Health Observatory. Geneva: World Health Organization (https://www.who.int/data/gho, accessed 10 July 2024).
6. About WHO’s work on health inequality monitoring. Geneva: World Health Organization (https://www.who.int/data/inequality-monitor/about, accessed 20 June 2024).
7. Health equity. Geneva: World Health Organization (https://www.who.int/health-topics/health-equity, accessed 6 June 2024).
8. McCartney G, Popham F, McMaster R, Cumbers A. Defining health and health inequalities. Public Health. 2019;172:22–30. doi:10.1016/j.puhe.2019.03.023.
9. Lee H, Kim D, Lee S, Fawcett J. The concepts of health inequality, disparities and equity in the era of population health. Appl Nurs Res. 2020;56:151367. doi:10.1016/j.apnr.2020.151367.
10. Whitehead M. The concepts and principles of equity and health. Health Promot Int. 1991;6(3):217–228.
11. Social determinants of health. Geneva: World Health Organization (https://www.who.int/health-topics/social-determinants-of-health, accessed 20 June 2024).
12. Global malaria programme. Geneva: World Health Organization (https://www.who.int/teams/global-malaria-programme, accessed 10 June 2024).
13. Global framework for the response to malaria in urban areas. Geneva: World Health Organization; 2022 (https://iris.who.int/handle/10665/363899, accessed 23 September 2024).
14. Epidemiology glossary. Atlanta, GA: Centers for Disease Control and Prevention; 2024 (https://www.cdc.gov/reproductive-health/glossary/?CDC_AAref_Val=https://www.cdc.gov/reproductivehealth/data_stats/glossary.html, accessed 7 June 2024).
15. Wehrmeister FC, Barros AJD, Hosseinpoor AR, Boerma T, Victora CG. Measuring universal health coverage in reproductive, maternal, newborn and child health: an update of the composite coverage index. PLoS One. 2020;15(4):e0232350. doi:10.1371/journal.pone.0232350.
16. Compendium of good practices in the health sector response to HIV in the WHO European Region. Copenhagen: World Health Organization Regional Office for Europe; 2018 (https://iris.who.int/handle/10665/342219, accessed 23 September 2024).
17. AIDSinfo. Geneva: Joint United Nations Programme on HIV and AIDS (https://aidsinfo.unaids.org, accessed 26 September 2024).
18. Immunization agenda 2030: a global strategy to leave no one behind. Geneva: World Health Organization; 2020 (https://www.who.int/publications/m/item/immunization-agenda-2030-a-global-strategy-to-leave-no-one-behind, accessed 20 June 2024).
19. Annex 2: IA2030 ownership and accountability (O&A) – a global-level partnership model. Geneva: World Health Organization (https://www.immunizationagenda2030.org/images/documents/Frame_for_Action_Annex_2_1.pdf, accessed 7 June 2024).