Annex 12. Examples of difference and ratio calculations with favourable and adverse health indicators
Favourable health indicators
For favourable health indicators, difference is calculated as the advantaged subgroup estimate minus the disadvantaged subgroup estimate. For example:
for economic status, the richest subgroup estimate minus the poorest subgroup estimate;
for education status, the most educated subgroup estimate minus the least educated subgroup estimate;
for urban–rural place of residence, the urban subgroup estimate minus the rural subgroup estimate.
Ratio is calculated as the advantaged subgroup estimate divided by the disadvantaged subgroup estimate. For example:
for economic status, the richest subgroup estimate divided by the poorest subgroup estimate;
for education status, the most educated subgroup estimate divided by the least educated subgroup estimate;
for urban–rural place of residence, the urban subgroup estimate divided by the rural subgroup estimate.
The following example from Indonesia presents data for urban and rural areas for the coverage of births attended by skilled health personnel – a favourable health indicator – in Indonesia at two time points (Table A12.1 and Figure A12.1). Difference is calculated as the urban estimate minus the rural estimate. Ratio is calculated as the urban estimate divided by the rural estimate. In this example, both absolute and relative place of residence inequality for this indicator declined over the 10-year period.
TABLE A12.1. Difference and ratio calculations: births attended by skilled health personnel, by place of residence, Indonesia
| Year |
Urban estimate (%) [A] |
Rural estimate (%) [B] |
Difference (percentage points) [A − B] |
Ratio [A / B] |
|---|---|---|---|---|
| 2007 | 88.6 | 65.2 | 23.4 | 1.4 |
| 2017 | 96.2 | 87.3 | 8.9 | 1.1 |
Source: derived from the WHO Health Inequality Data Repository Reproductive, Maternal, Newborn and Child Health dataset (1), with data sourced from the 2007 and 2017 Demographic and Health Surveys. Data are based on three years prior to the survey.
FIGURE A12.1. Births attended by skilled health personnel, by place of residence, Indonesia

Source: derived from the WHO Health Inequality Data Repository Reproductive, Maternal, Newborn and Child Health dataset (1), with data sourced from the 2007 and 2017 Demographic and Health Surveys. Data are based on three years prior to the survey.
Adverse health indicators
For adverse health indicators, difference is calculated as the disadvantaged subgroup estimate minus the advantaged subgroup estimate. For example:
for economic status, the poorest subgroup estimate minus the richest subgroup estimate;
for education status, the least educated subgroup estimate minus the most educated subgroup estimate;
for urban–rural place of residence, the rural subgroup estimate minus the urban subgroup estimate.
Ratio is calculated as the disadvantaged subgroup estimate divided by the advantaged subgroup estimate. For example:
for economic status, the poorest subgroup estimate divided by the richest subgroup estimate;
for education status, the least educated subgroup estimate divided by the most educated subgroup estimate;
for urban–rural place of residence, the rural subgroup estimate divided by the urban subgroup estimate.
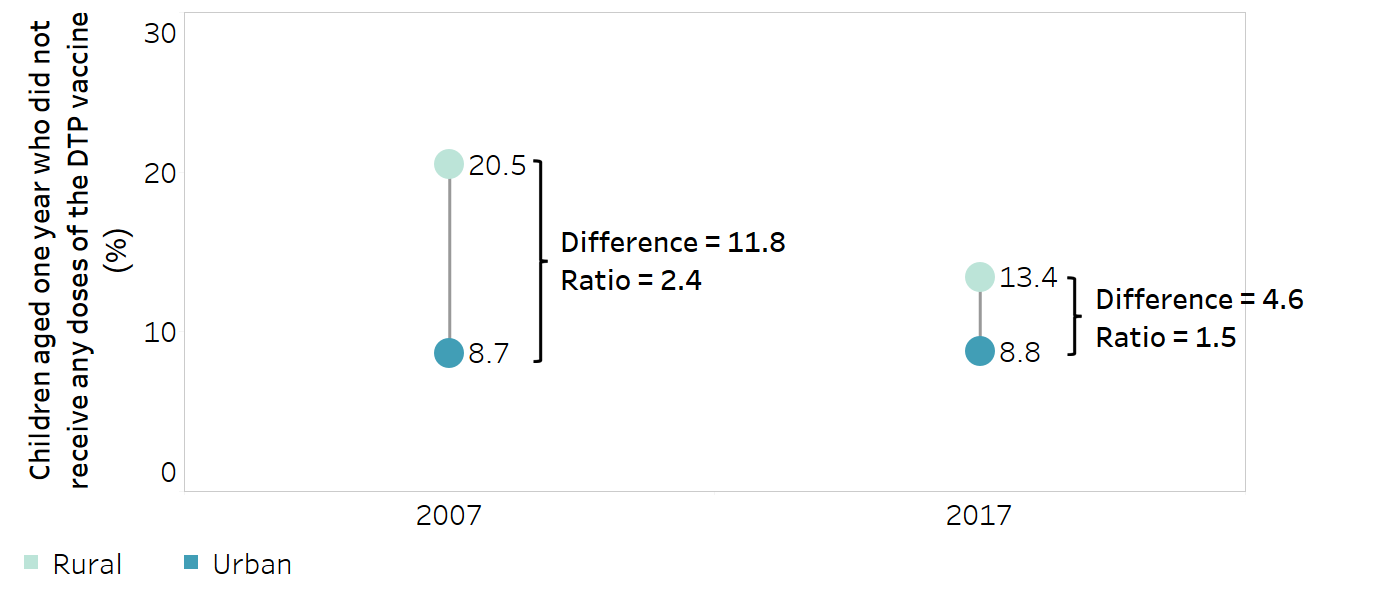
Another example from Indonesia presents data for urban and rural areas for the adverse indicator, children aged one year with zero doses of the diphtheria, tetanus toxoid and pertussis (DTP) vaccine, at two time points (Table A12.2 and Figure A12.2). Difference is calculated as the rural estimate minus the urban estimate. Ratio is calculated as the rural estimate divided by the urban estimate. This example demonstrates a reduction in absolute and relative place of residence inequality for zero-dose DTP prevalence among children in Indonesia over this time period. Improvements among the rural subgroup are evident from the disaggregated data.
TABLE A12.2. Difference and ratio calculations: children aged one year who did not receive any doses of diphtheria, tetanus toxoid and pertussis vaccine, by place of residence, Indonesia
| Year |
Urban estimate (%) [A] |
Rural estimate (%) [B] |
Difference (percentage points) [A − B] |
Ratio [A / B] |
|---|---|---|---|---|
| 2007 | 8.7 | 20.5 | 11.8 | 2.4 |
| 2017 | 8.8 | 13.4 | 4.6 | 1.5 |
Source: derived from the WHO Health Inequality Data Repository Reproductive, Maternal, Newborn and Child Health dataset (1), with data sourced from the 2007 and 2017 Demographic and Health Surveys.
FIGURE A12.2. Children aged one year who did not receive any doses of diphtheria, tetanus toxoid and pertussis (DTP) vaccine, by place of residence, Indonesia
Source: derived from the WHO Health Inequality Data Repository Reproductive, Maternal, Newborn and Child Health dataset (1), with data sourced from the 2007 and 2017 Demographic and Health Surveys.
Reference
1. Health Inequality Data Repository. Geneva: World Health Organization (https://www.who.int/data/inequality-monitor/data, accessed 20 June 2024).