Chapter 11. Data requirements for health inequality monitoring
Overview
The most basic data requirement for inequality monitoring is disaggregated data. As used here, the term “disaggregated data” refers to population-level data presented by subgroups defined by a dimension of inequality, such as age, economic status, education level, place of residence, sex or subnational region. Disaggregated health data capture information about a health indicator (or determinant of health indicator) and information about an inequality dimension.
The selection of health indicators and dimensions of inequality defines the scope of health inequality monitoring, which depends on the availability of data from high-quality sources. Disaggregated data for health inequality monitoring can be obtained from a single data source if that source contains information about both health indicators and dimensions of inequality of interest. Alternatively, if common identifiers are present across different sources, the relevant information can be linked from multiple sources.
This chapter provides foundational information about disaggregated data for health inequality monitoring, including data source quality. It also gives an overview of common data sources used for health inequality monitoring. The chapter serves as an introduction to Chapters 12–16, which provide more in-depth discussions related to data for health inequality monitoring, and to the chapters in Part 4, which discuss analysis and interpretation of disaggregated data (Chapters 17 and 18) and summary measures of health inequality (Chapters 19–22). See Chapter 3 for general considerations and resources to guide the selection of health topics, health indicators and dimensions of inequality.
Disaggregated data
Health inequality monitoring requires information about health indicators (defined as a measurable quantity that can be used to describe a population’s health or its determinants) and information about dimensions of inequality (the criteria upon which population subgroups are categorized for inequality monitoring – sometimes called “equity stratifiers”). When these two streams of information are combined, they yield disaggregated data on health or health determinants Box 11.1.
Disaggregated data for health inequality monitoring contain information on health or determinants of health, by population subgroups. Disaggregated data can show underlying inequality patterns that are not evident from overall averages across a whole population.
BOX 11.1. Disaggregated data: a note on terminology
Disaggregated data are specific to population subgroups, which are defined by a dimension of inequality such as age, economic status, education level, place of residence, sex or subnational region. Data that are aggregated at a population level (e.g. national average) can be said to be disaggregated when they are broken down according to a dimension of inequality. For example, the average self-rated health in a country could be disaggregated by sex and presented separately as disaggregated values for females and males.
Microdata (e.g. survey responses) are often collected at the individual level and then aggregated according to a particular inequality dimension. Therefore, disaggregated values are sometimes termed “aggregated group means”. For example, self-rated health among men is the mean of self-rated health scores reported by individual men.
Disaggregated data can show underlying trends and patterns that would not be evident when using data that show the average value for a whole population. For example, among 36 countries in the WHO European Region, the median percentage of people having a longstanding illness or health problem between 2018 and 2020 was 35.6% ( Figure 11.1). Data disaggregated by three education levels reveal that people with the lowest level of education (no, primary or lower secondary education) more often reported illness and health problems (median 44.3%) compared with people with upper secondary education (median 36.2%) and people with tertiary education (median 26.3%).
FIGURE 11.1. Median percentage of people with a longstanding illness or health problem, by education level across 36 countries in the WHO European Region
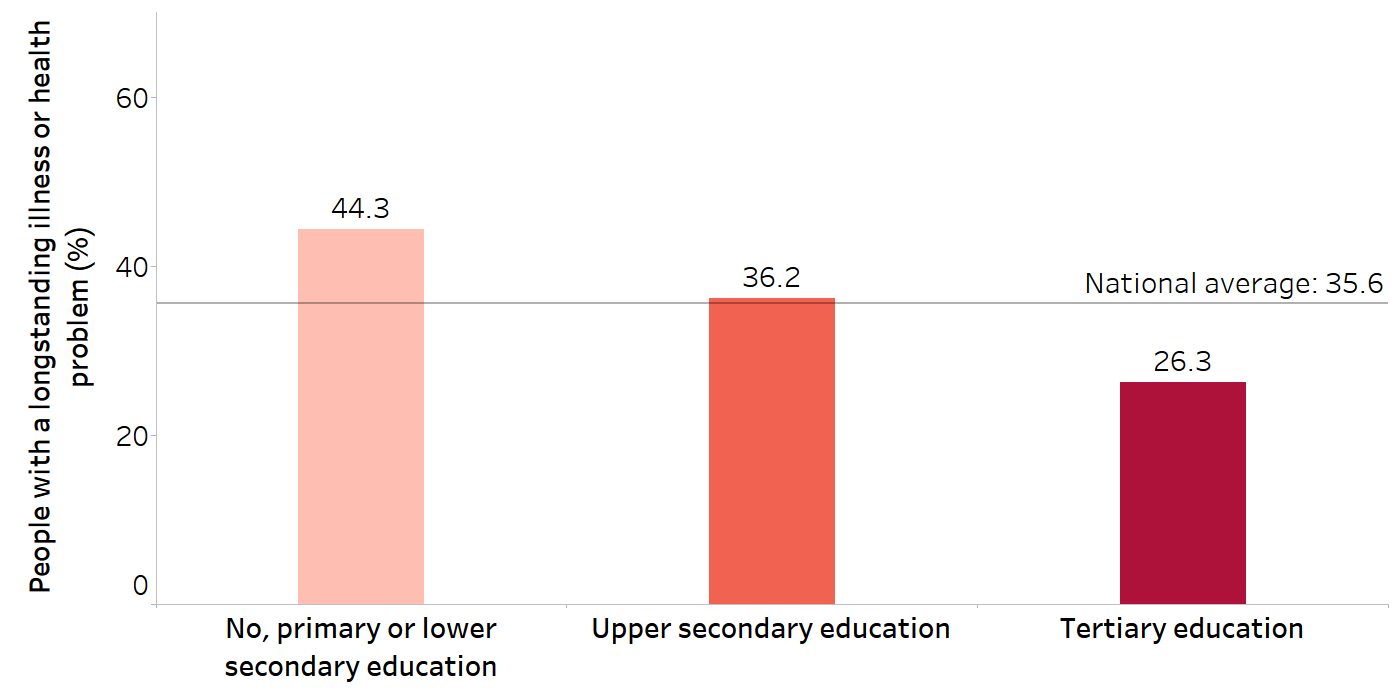
Source: derived from the WHO Health Inequality Data Repository Adult Health dataset (1), with data sourced from Eurostat 2018–2020.
As another example, Figure 11.2 illustrates disaggregated data for a determinant of health – median net attendance rate at secondary school – in the WHO African Region between 2012 and 2021. The overall median attendance rate across 32 countries was 33.8%. When the data are disaggregated according to wealth quintiles, however, it becomes evident that the median attendance rate among the poorest quintile (12.2%) was substantially lower than the median attendance among the richest quintile (59.5%).
FIGURE 11.2. Median net attendance rate at secondary school, by economic status across 32 countries in the WHO African Region
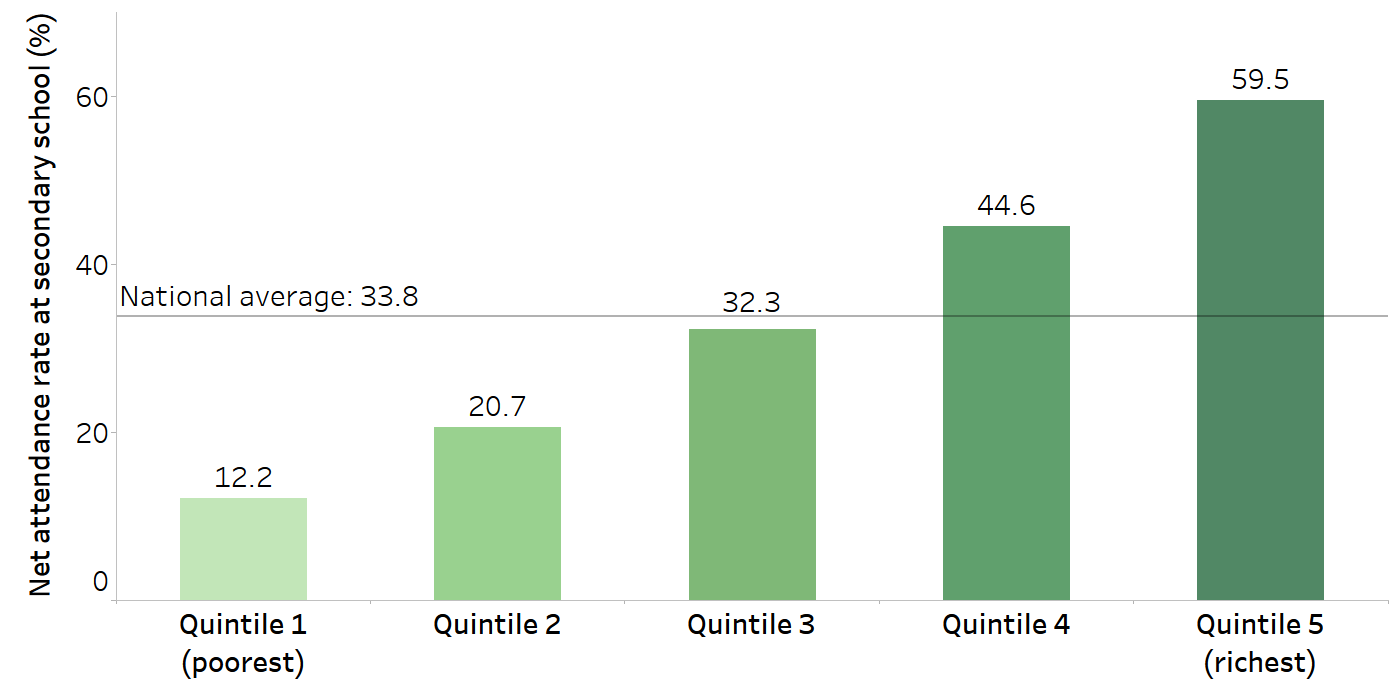
Source: derived from the WHO Health Inequality Data Repository Health Determinants dataset (1), with data sourced from the most recent Demographic and Health Survey between 2012 and 2021.
Disaggregation allows for comparisons across subgroups within a population and, if available, analysis of temporal trends. Disaggregated data permit initial insights into how dimensions of inequality intersect with health, which ultimately contribute to more targeted and efficient responses to combat inequities and improve health for all. To ensure disaggregation is meaningful, dimensions of inequality should capture factors that are relevant to the monitoring context (see Chapter 3). In some cases, data pertaining to the health experiences of certain populations must go beyond a single dimension, filtering by two or more dimensions simultaneously, a practice termed double or multiple disaggregation. Box 11.2 demonstrates how one factor – disability status – may be featured in disaggregated data in various ways.
In the context of health inequality monitoring, double or multiple disaggregation is a starting point for exploring intersectionality. Intersectionality is a concept describing how interconnected dimensions of inequality (especially race/ethnicity, income/wealth and gender) interact to create different experiences of privilege, vulnerability or disadvantage.
BOX 11.2. Disaggregated data and disability status
The WHO Global report on health equity for persons with disabilities documents evidence on health inequalities and country experiences in advancing health equity in the context of disability (2). Table 11.1 shows three examples of how disability status may be considered as part of health inequality monitoring. It can be included as a health indicator (Row 1) or dimension of inequality (Row 2). Disability status may also be applied to define the affected population (Row 3).
TABLE 11.1. Examples of disaggregation linked to disability status
| Affected population | Health or health determinant indicator | Dimension of inequality | Disaggregated data | |
|---|---|---|---|---|
| 1 | National population | Disability status | Sex (men and women) | Disability status among men versus womena |
| 2 | National population | Experience of violence or rape | Disability status | Experience of violence or rape among people living with a disability versus people without a disabilityb |
| 3 | People living with a disability | People at risk of poverty | Sex (men and women) | Risk of poverty among men versus women living with a disabilityc |
a In most Organisation for Economic Co-operation and Development countries, women report higher incidence of disability than men (3).
b People living with a disability are more likely to experience violence or rape (3).
c The WHO Health Inequality Data Repository Disability dataset contains sex-related disaggregated data on people at risk of poverty among people living with some disability or severe disability (1).
Health indicators
For the purposes of health inequality monitoring, health indicators are used to monitor performance, measure results against targets and assess accountability. Health and health-related indicators may address a variety of different aspects related to health, including health status, health outcomes, health service use, intervention coverage, health sector factors and determinants of health Box 11.3. Composite indicators combine multiple health indicators into an index to summarize information about a health topic.
BOX 11.3. Determinants of health
Determinants of health are factors that combine to affect the health of individuals and communities. Determinants of health include the social and economic environment, the physical environment, and the person’s individual characteristics and behaviours (4).
Social determinants of health are the conditions in which people are born, grow, work, live and age, and people’s access to power, money and resources (5). Monitoring inequalities in social determinants of health indicators (disaggregated by relevant inequality dimensions) can foster a deeper understanding of factors that may be associated with, or potential contributors to, health inequities and their underlying mechanisms (see Chapter 9).
The WHO Health Inequality Data Repository contains national-level disaggregated data for social determinants of health indicators, such as:
indicators related to education, communication, employment and household characteristics, disaggregated by age, economic status, education, employment type, marital status, number of living children, place of residence, sex and subnational region;
indicators related to child protection and female genital mutilation, disaggregated by age, economic status, education, employment status, marital status, number of living children, place of residence, religion, sex and subnational region;
women’s empowerment index indicators, disaggregated by economic status, education, place of residence and subnational region;
development indices (e.g. Gender Development Index, Gini coefficient, Human Development Index, International Wealth Index, Theil Index) and their component indicators, disaggregated, as applicable, by economic status, place of residence, poverty status and subnational region;
the Multidimensional Poverty Index, disaggregated by age, ethnicity/race/caste, place of residence, sex of household head and subnational region (1).
The WHO Health Equity Assessment Toolkit contains an interactive feature that demonstrates the associations between health determinants and health indicators (6).
The selection of health and health-related indicators used for health inequality monitoring should reflect the defined purpose and intended impact of the monitoring activity. An initial consideration is the desired breadth of the health topic. Will the topic be narrowly defined? If this is the case, a smaller set of indicators directly linked with the topic would be most appropriate. For example, indicators may reflect the coverage of a particular intervention and associated health outcomes. As another example, indicators could be selected to show health service access across the continuum of care for a particular condition.
Alternatively, a broad lens may incorporate a wider selection of health indicators across aspects of the health sector and other health-related indicators.
For more examples of health indicators and information about selecting relevant health indicators, see Chapter 3. Chapter 17 covers defining and constructing health indicators.
Dimensions of inequality
Dimensions of inequality are the criteria used to define the population subgroups that serve as the basis of comparison for inequality monitoring. Certain inequality dimensions are commonly used in inequality monitoring because they have a high level of applicability across many health topics and settings. Additionally, data about these dimensions tend to be available in a format whereby they can be similarly constructed and compared across countries and health topics. These dimensions include age, economic status, education level, place of residence, sex and subnational region.
Other dimensions such as subnational region and disability status tend to be highly applicable across settings as inequality dimensions, although there are certain limitations to their use. In the case of subnational region, the number and composition of subgroups (i.e. regions) is unique to the country of interest, limiting comparability across settings. Data on disability status are not readily available in many settings.
Context-specific dimensions of inequality are numerous and varied, including caste or tribe, ethnicity or race, incarceration status, Indigenous identity, language spoken at home, marital status, migratory status, occupation, religion, and sexual orientation and gender identity. These dimensions of inequality have variable applicability, depending on the setting and health topic.
See Chapter 3 for more information about selecting dimensions of inequality, and Chapter 17 on their measurement and categorization.
Attributes of high-quality data sources
For the purposes of health inequality monitoring, data sources contain quantitative information about health indicators and/or dimensions of inequality for a population of interest. To the extent possible, data for health inequality monitoring should be obtained from sources that are reputable, with strong legitimacy and a high degree of policy relevance.
High-quality data collection systems share a number of general attributes (7) described by the acronym CART – credible, actionable, responsible and transportable Box 11.4. Additionally, they should collect information in a way that is ethical and culturally appropriate, upholding the rights and interests of the populations they represent, including people’s rights to govern their own information (see Chapter 4).
BOX 11.4. CART principles for strong data collection systems
CART – credible, actionable, responsible and transportable – highlights four key principles for strong data collection systems (8):
Credible data sources collect high-quality data and analyse them accurately.
Actionable data sources collect data that can be used to inform or effect change.
Responsible data sources seek to ensure the benefits of data collection outweigh the costs, including minimizing risks to the individuals from whom data are collected.
Transportable data sources collect data that generate knowledge that can be generalized, as needed, for other programmes.
In some cases, monitoring will involve the use of a single data source that contains all relevant information. In other cases, data may be drawn from several different sources, including merging information from different sources about the same person or entity using individual or small-area identifiers (i.e. data linking).
Ideally, the sources selected for health inequality monitoring should contain data that are of high quality. Key attributes of data quality include relevance, credibility, accuracy, timeliness, methodological soundness, accessibility, completeness and reliability:
Relevant data are those that meet the users’ needs – that is, relate to the policy issue being monitored (9).
Credibility is the confidence that users place in the data (9).
Accuracy is the degree of closeness of estimates to the actual situation (9).
Timeliness refers to the degree to which reports are submitted on time according to established deadlines. Health information systems data are timely when they are up to date (current), and when the information (processing of data) is available when required to make decisions about the health of the population and to target resources to improve health-system coverage, efficiency and quality (10).
Methodological soundness is the application of the available international standards, guidelines and good practices in the production of data (9).
Accessibility is the ease with which users can find, retrieve, understand and use data (9).
Completeness is when all required data for the health indicator and inequality dimension are present and, if applicable, representative of the population of interest.
Reliable data provide consistent estimates when collected repeatedly using the same procedures and under the same circumstances (10).
Data sources should include readily accessible and up-to-date metadata (detailed information about the data) defining indicators and explaining the underlying methodologies, limitations and other considerations to assess the quality of the data and how they can be used. Efforts to support health data source quality improvements include the WHO SCORE (Survey, Count, Optimize, Review, Enable) for Health Data Technical Package (Box 11.5).
BOX 11.5. SCORE for Health Data Technical Package
The SCORE for Health Data Technical Package, developed by WHO and partners, serves as a harmonized package of effective interventions to tackle critical gaps and strengthen country health data (11). These data are essential for planning and monitoring national and subnational health priorities, including the health-related Sustainable Development Goals. The SCORE global reports and dashboards provide insights into the strength of data sources in countries. The package of interventions supports the improved quality, availability, analysis, use and accessibility of data in countries.
Potential sources of disaggregated data may not completely fulfil all these requirements. Indeed, the quality of the data always relies on the design and implementation of protocols related to the data source. Careful consideration may be needed to ensure the best data quality possible is achieved, weighing each of the attributes. In some cases, information about health and information about dimensions of inequality may need to be located and linked across different sources. In other cases, there may be a multitude of potential sources of data that could be used for monitoring. Chapter 15 contains further information about selecting data sources and addressing data gaps.
Any data quality concerns that may impact on the subsequent analysis should be noted and taken into consideration when interpreting and reporting the results of monitoring.
General classes of data sources
WHO and partners acknowledge the importance of multiple well-functioning data sources as a component of a country-led platform for monitoring, evaluation and review (alongside sound policy and institutional environments; strong institutional capacity for data collection, management, analysis, use and dissemination; and effective mechanisms for review and action) (12). Different data sources play a role in monitoring key health indicators across public health surveillance and practice, and systems productivity and effectiveness. Two major categories of data sources are commonly used for health inequality monitoring – population-based sources and institution-based sources.
Comprehensive country health information systems should support the use of diverse data sources to monitor a broad range of health and health-related indicators.
Population-based sources collect data from a representative sample of a population, such as a household survey; or they contain information on every individual in a population, such as a civil registration and vital statistics system or census. Chapter 12 discusses population-based data sources in more depth.
Institution-based sources collect information in the course of administrative and operational activities. Examples of institution-based data include records kept by health facilities, such as disease registers or health service use records, or records kept by institutions outside the health sector. These sources are discussed in Chapter 13.
Health inequality monitoring may use other data sources that are not strictly population- or institution-based. For example, surveillance systems draw from both population- and institution-based data, usually with the purpose of detecting, reporting and responding to specific diseases or conditions in a time-sensitive way. Health facility assessments, including health facility censuses or health facility surveys, are conducted periodically within public and private health-care facilities to gather data about the facilities and the services provided. In the absence of reliable direct measures, modelled estimates derived by applying statistical methods to unreliable data may be necessary; the assumptions underlying such modelling methods, however, should be transparent and well documented. For more details about surveillance systems, health facility assessments and other sources of data, see Chapter 14. Chapter 15 addresses considerations for how to select data sources. Emerging and novel data sources are discussed in Chapter 16.
References
1. Health Inequality Data Repository. Geneva: World Health Organization (https://www.who.int/data/inequality-monitor/data, accessed 15 May 2024).
2. Global report on health equity for persons with disabilities. Geneva: World Health Organization; 2022 (https://iris.who.int/handle/10665/364834, accessed 15 May 2024).
3. Factsheet on persons with disabilities. New York: United Nations Department of Economic and Social Affairs (https://www.un.org/development/desa/disabilities/resources/factsheet-on-persons-with-disabilities.html, accessed 15 May 2024).
4. Determinants of health. Geneva: World Health Organization; 2017 (https://www.who.int/news-room/questions-and-answers/item/determinants-of-health, accessed 15 May 2024).
5. Social determinants of health. Geneva: World Health Organization (https://www.who.int/health-topics/social-determinants-of-health#tab=tab_1, accessed 15 May 2024).
6. Health Equity Assessment Toolkit. Geneva: World Health Organization (https://www.who.int/data/inequality-monitor/assessment_toolkit, accessed 3 June 2024).
7. Quality assurance framework of the European Statistical System, Version 2.0. Luxembourg: European Statistical System; 2019 (https://ec.europa.eu/eurostat/documents/64157/4392716/ESS-QAF-V1-2final.pdf/bbf5970c-1adf-46c8-afc3-58ce177a0646, accessed 15 May 2024).
8. Gugerty MK, Karlan D. The Goldilocks challenge: right-fit evidence for the social sector. Oxford: Oxford University Press; 2018.doi:10.1093/oso/9780199366088.001.0001.
9. United Nations Statistics Division. Data quality framework. Presented at the Regional Workshop on International Merchandise Trade Statistics, Suzhou, China, 11–13 September 2017 (https://unstats.un.org/unsd/trade/events/2017/suzhou/presentations/Agenda%20item%2014%20-%20UNSD%20(revised).pdf, accessed 15 May 2024).
10. Data quality assurance: a toolkit for facility data quality assessment. Module 1: framework and metrics. Geneva: World Health Organization; 2020 (https://cdn.who.int/media/docs/default-source/world-health-data-platform/rhis-modules/dqa-module-1-framework-and-metrics.pdf, accessed 15 May 2024).
11. SCORE for Health Data Technical Package. Geneva: World Health Organization (https://www.who.int/data/data-collection-tools/score, accessed 15 May 2024).
12. O’Neill K, Viswanathan K, Celades E, Boerma T. Monitoring, evaluation and review of national health policies, strategies and plans. In: Schmets G, Rajan D, Kadandale S, editors. Strategizing national health in the 21st century: a handbook. Geneva: World Health Organization; 2016:447–490 (https://iris.who.int/handle/10665/250221, accessed 15 May 2024).