Chapter 3. Health indicators and dimensions of inequality
Overview
Central questions when undertaking health inequality monitoring activities include: Which health topics should be included in monitoring? Within a selected topic, what indicators should be included? And, for selected health indicators, according to which characteristics (i.e. dimensions of inequality) should inequality be assessed?
The answers to these questions may not be straightforward. The selection of a health topic for health inequality monitoring requires consideration of background and contextual information related to the purpose of monitoring, the anticipated impact of monitoring, and its relevance to policy and programme priorities. Familiarity and engagement with the needs and interests of diverse stakeholders, including affected populations, can yield further insights into potential indicators and dimensions of inequality for inclusion in monitoring. Additionally, there are practical considerations related to timing, resource availability (including data availability and quality), and opportunities for meaningful engagement with relevant stakeholders, including communities and groups.
The objective of this chapter is to introduce considerations and resources to guide the selection of health topics, health indicators and dimensions of inequality for health inequality monitoring. Building on Chapter 2, this chapter underscores the importance of designing monitoring activities that are relevant and impactful. As a more technical complement to this chapter, techniques for the preparation of disaggregated data, including approaches to defining and constructing health indicators and measuring and categorizing dimensions of inequality, are covered in Chapter 17.
Reviewing background and contextual information
Background information about the context of monitoring and existing evidence should be consulted throughout the steps of inequality monitoring. Extensive knowledge about the population, setting and context is particularly important at the initial planning stages to ensure the proposed monitoring will be meaningful and impactful, and to avoid duplicating previous or ongoing efforts. Reviewing background and contextual information entails consulting with a wide range of stakeholders (See Chapter 4) and reviewing existing evidence from previous qualitative and quantitative analyses. Box 3.1 outlines various approaches to synthesizing evidence. See Chapter 24 for more about how evidence can be integrated with the results of health inequality monitoring to inform further action.
BOX 3.1. Evidence synthesis approaches
The following descriptions are adapted from Evidence, policy, impact: WHO guide for evidence-informed decision-making (1):
Evidence and gap maps are systematic evidence synthesis products that display the available evidence relevant to a specific research question. They are used to identify gaps that require filling with new evidence. They may support efforts to assemble collections of studies for review, and increase the discoverability and use of studies by decision-makers, research commissioners and researchers.
Meta-analysis is a statistical method used to combine results from relevant studies. Having larger sample sizes increases the ability to provide reliable estimates.
Modelling is the use of mathematical equations and existing data and research to simulate real-world scenarios and options.
Qualitative synthesis is a method for integrating or comparing the findings from qualitative studies. It looks for themes or constructs that exist in individual qualitative studies.
Rapid review is a type of systematic review in which components of the systematic review process are simplified, omitted or made more efficient to produce information in a shorter period of time, preferably with minimal impact on quality.
Scoping review is an overview of the research evidence available without producing a summary answer to a discrete research question.
Systematic review is a review of the evidence on a clearly formulated question that uses systematic and explicit methods to identify, select and critically appraise relevant primary research, and to extract and analyse data from the studies included in the review.
Selecting a health topic for inequality monitoring
WHO offers an expansive definition of health as a state of complete physical, mental and social well-being and not merely the absence of disease or infirmity (2). Within this understanding of health, there are numerous health topics that constitute potential areas of inquiry for inequality monitoring. A given iteration of health inequality monitoring may, for example, address specific diseases such as HIV, tuberculosis or malaria, or it may pertain to a cross-cutting topic such as the health service delivery, health workforce or measures of well-being. Inequality monitoring may focus on a particular life stage, such as adult health or reproductive, maternal and child health, or it may align with an established set of priorities, such as the Sustainable Development Goals (SDGs) or the WHO General Programme of Work.
Annexes 1 and 2 highlight considerations for inequality monitoring in two topics: social determinants of health (SDH) and health expenditure. Monitoring inequalities in SDH is an important part of global efforts to emphasize tackling inequalities from the causes of the causes. Evidence about SDH, and how they are experienced within a population, can also help to inform the selection of relevant health indicators and dimensions of inequalities for monitoring. Monitoring inequalities in health expenditure is part of ensuring financial protection from catastrophic and impoverishing out-of-pocket health expenditure (in the case of private out-of-pocket health expenditure) and promoting equity, transparency, accountability and efficiency (in the case of public health expenditure).
SDH are the conditions in which people are born, grow, work, live and age, and people’s access to power, money and resources (3). SDH also refer to structural factors such as laws, policies and deeply entrenched practices that are the drivers of those conditions. See Chapter 9 for more on the importance of SDH in understanding and addressing health inequalities.
The selection of a health topic should take into consideration the population and circumstances in which monitoring is conducted. Monitoring might focus on health topics that have specific relevance to a particular population, context or geographical area. For example, Chapter 5 addresses inequality monitoring in lower- and higher-resourced settings, rural and remote settings, refugee and migrant populations, and emergency contexts. The health topic for a given inequality monitoring activity should be articulated by a guiding overarching objective or, depending on the application, a research question. Some monitoring activities may be focused on a single, narrowly defined topic, but other monitoring activities encompass a broader topic or multiple topics. The selected topic (or topics) for health inequality monitoring sets the scene for the selection of health indicators and dimensions of inequality, which are addressed in the subsequent sections of this chapter.
Health indicators
Health indicators provide metrics that can be used to monitor performance, measure results against targets, and assess accountability for a defined health topic. Health indicators may capture different aspects of health status, risk factors, service coverage and the health system (4), as well as determinants of health. Some of the health indicators used to illustrate concepts across chapters of this book include:
stunting prevalence in children aged under five years (%);
hypertension among adults aged 30–79 years (%);
people who have ever tested for HIV and received their test results (%);
adolescent fertility rate (births per 1000 women aged 15–19 years).
Indicators selected for inequality monitoring should be aligned with the purpose of monitoring and its intended impact, as per the monitoring objective or research question. Indicators should reflect the needs, interests and preferences of stakeholders and knowledge users. Ideally, indicators should have a strong scientific basis and be aligned with what is considered appropriate to the monitoring population and relevant for policy and programme development.
Health indicators used as part of health inequality monitoring must be disaggregated according to a dimension of inequality.
A set of multiple, complementary indicators is often selected for inequality monitoring within a given health topic. Monitoring activities with a narrower focus may involve selecting a more concise set of indicators directly linked to the topic. For example, an exploration of inequalities in COVID-19 vaccination coverage may consider a limited number of indicators related to vaccine receipt or non-receipt and associated barriers and attitudes (5). Monitoring with a broader perspective may encompass a more diverse range of indicators. An assessment aiming to capture inequalities related to COVID-19 more broadly might entail a set of indicators reflecting prevention and control efforts, exposures and outcomes, as well as indicators related to the health system more generally.
Often, consideration is given to ensure numerous indicators are selected that are distinct enough to represent diverse aspects of the topic. Selection of only one or two indicators within a topic can lead to perverse incentives – that is, too much attention and resources may be devoted to addressing a narrow aspect of the topic, without due consideration of the wider health or social context. In this case, actions to improve health and reduce inequality may hit the target but miss the goal.
WHO Monitoring, Evaluation and Review Framework
The WHO Monitoring, Evaluation and Review Framework organizes health indicators into four components: inputs and processes, outputs, outcomes and impacts (6, 7). These components are described further in Box 3.2. Recognizing the larger aspiration of improving population health outcomes, the components present a continuum along which aspects of the health sector can be evaluated to identify successes and challenges (Figure 3.1).
BOX 3.2. Components of the WHO Monitoring, Evaluation and Review Framework
Input and process indicators: input indicators measure human and financial resources, physical facilities, equipment and operational policies that enable programme activities to be implemented. This includes health financing, health workforce, health infrastructure, health information and communication technologies, and governance. Process indicators measure programme activities and outputs (direct products or deliverables of the activities). They include supply chain and information indicators. Together, measures of activities and outputs indicate whether the programme is being implemented as planned (e.g. health workforce training, constructing a health facility, process of registering births and deaths) (4, 8).
Output indicators: these measure the results of a process in terms of service access, availability, quality, safety and health security (4, 8).
Outcome indicators: these measure whether the programme is achieving the expected effects or changes in the short, intermediate and long term. Some programmes refer to the longest-term or most distal outcome indicators as impact indicators. This usually includes coverage of interventions, risk factors and behaviours (4, 8).
Impact indicators: these measure long-term outcomes that programmes are designed to affect, including decreases in mortality and morbidity (4, 8).
FIGURE 3.1. WHO Monitoring, Evaluation and Review Framework
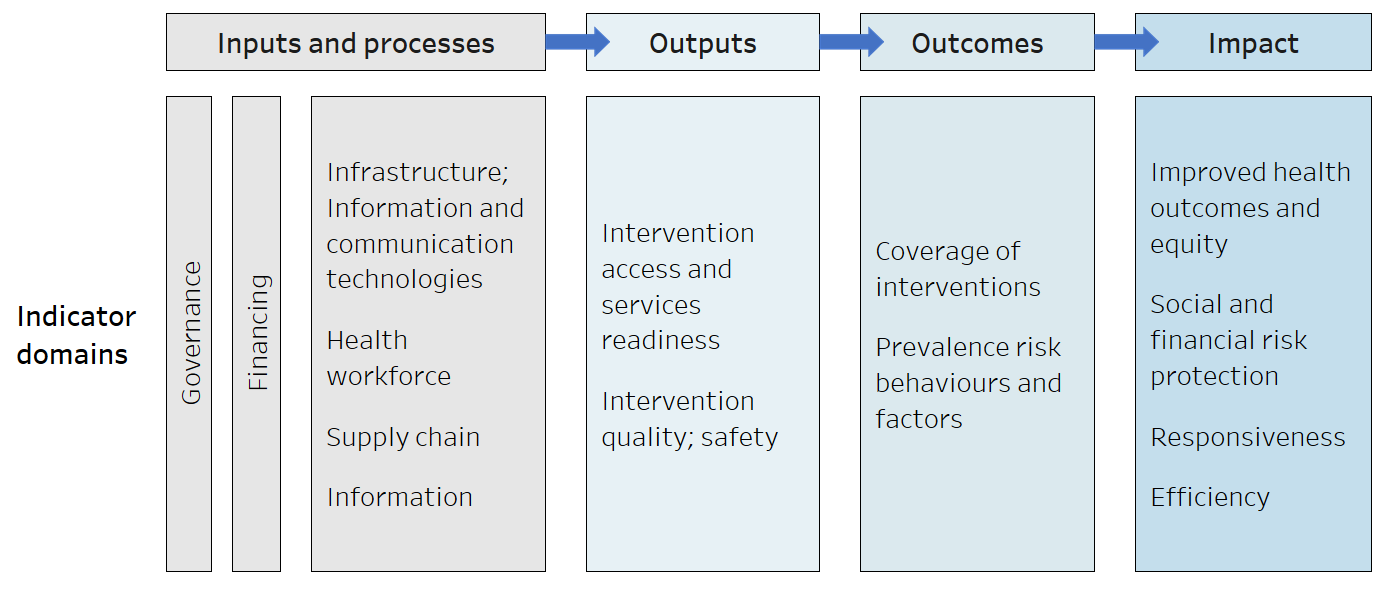
Source: derived from World Health Organization (6).
Indicators of inputs and processes are broad, cutting across many parts of the health sector. Although inputs and processes can be scarcely correlated with health outcomes (e.g. because different populations face different burdens of disease), these condition an environment that will be conducive or inimical to health improvements, hence the importance of measuring them.
Output indicators tend to be more specific to a particular health topic and more responsive to changes in the health sector. Outputs, as well as inputs and processes, reflect the actions – and their immediate consequences – needed to achieve the desired improvement in outcome inequalities. These actions, however, act through complex pathways and do not always have a direct or intended effect on outcomes.
Outcome indicators, like output indicators, pertain to specific health topics. They capture aspects of programmes that may be strongly correlated with population health outcomes.
Impact indicators, which may be slower to respond to policy, programme and practice changes, are ultimately what matter, because they measure improvement in the health of a population.
Figure 3.2 shows an example set of indicators across the four components that could be used to monitor inequalities in immunization programmes. In some applications of health inequality monitoring, it may be useful to select health indicators across all four components to obtain a comprehensive understanding of the situation. Other applications of monitoring, however, may not entail the use of indicators across all components.
FIGURE 3.2. Example of a set of indicators applicable to monitoring inequalities in immunization
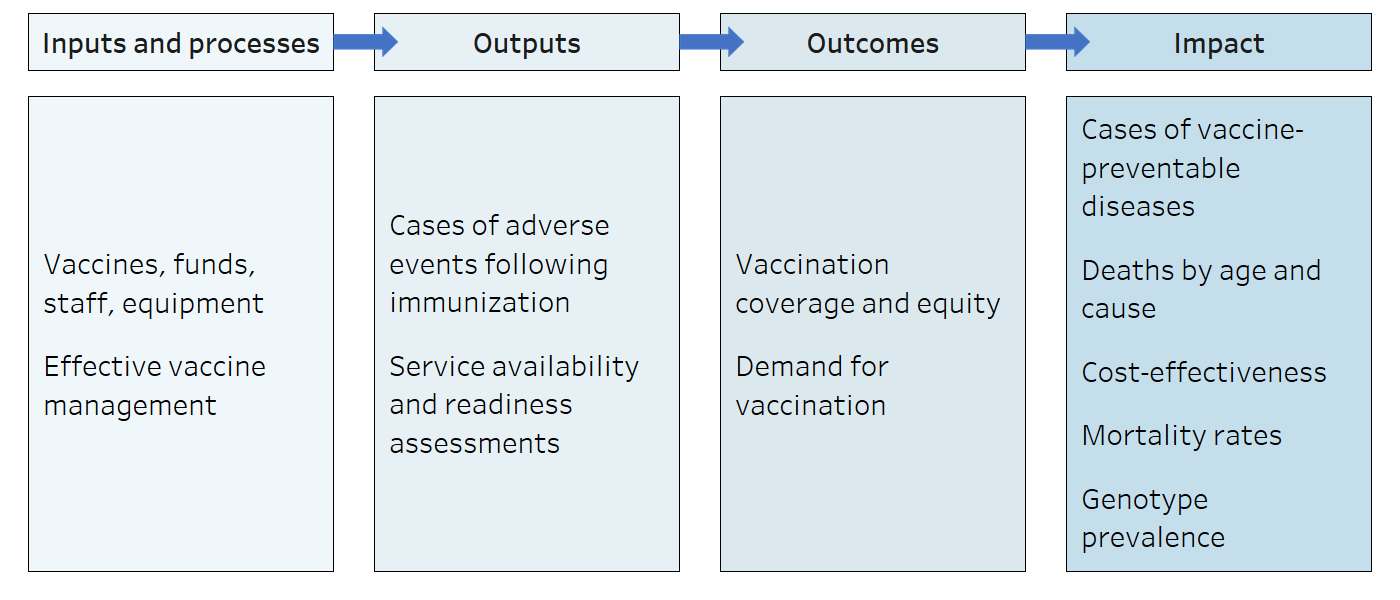
Source: derived from World Health Organization (9).
Tracer and composite indicators
When monitoring a broad health topic, the use of tracer or composite indicators may be applicable. A tracer indicator is chosen as an example to represent a health topic because the indicator and the topic are strongly associated. Tracer indicators are straightforward to understand and report, but they may not be representative of a broader topic, especially if special efforts are dedicated to a specific intervention or programme simply because it is being monitored (i.e. perverse incentives). Relatedly, proxy indicators are those that stand in for another indicator or topic that is difficult to measure or for which data are limited.
Composite indicators combine multiple indicators, sometimes across different health topics, into an index, generating an overall picture of the health topic. Composite indicators are useful to summarize information about a health topic and make comparisons between countries and over time, but they tend to be complex to report and understand. Additionally, problems with any one component of a complex indicator may introduce bias or render the index meaningless (10). For more on constructing composite health indicators, See Chapter 17.
Box 3.3 provides examples of tracer, proxy and composite indicators for the topic of reproductive, maternal, newborn and child health.
BOX 3.3. Examples of tracer, proxy and composite indicators
A frequently used tracer indicator of health service coverage in reproductive, maternal, newborn and child health is the coverage of births attended by skilled health personnel. Higher coverage of skilled birth attendance is understood to be associated with better reproductive, maternal, newborn and child health service coverage more generally. Chapters 19–21 on summary measures of health inequality feature this indicator in several examples.
An example of a proxy indicator used in childhood immunization is pentavalent vaccine coverage, which provides protection from five diseases and is typically administered to infants at six, 10 and 14 weeks of age. It is used as a proxy for access to routine immunization services, and it can be used to estimate the number of “zero-dose children” who have not received their first dose of the diphtheria, tetanus toxoid and pertussis (DTP) vaccine (11).
An example of a composite indicator relevant to reproductive, maternal, newborn and child health is the composite coverage index (12). This is a weighted score reflecting the coverage of eight interventions along the continuum of care: demand for family planning satisfied (modern methods); antenatal care coverage (at least four visits); births attended by skilled health personnel; Bacillus Calmette–Guérin (BCG) immunization coverage among children aged one year; measles immunization coverage among children aged one year; immunization coverage with a third dose of the DTP vaccine among children aged one year; children aged under five years with diarrhoea receiving oral rehydration therapy and continued feeding; and children aged under five years with pneumonia symptoms taken to a health facility.
Another example of a composite indicator is the universal health coverage service coverage index (13). This is made up of 14 indicators across a wide selection of essential health services in four areas: reproductive, maternal, newborn and child health; infectious diseases; noncommunicable diseases; and service capacity and access.
Global indicator lists
Monitoring activities across different levels serve different purposes, which are reflected in the selection of health indicators. Global monitoring frameworks of recommended universal indicators are a good starting point for selecting indicators with relevance across settings. The indicators included in global monitoring frameworks reflect common metadata – that is, technical specifications for how the indicator is defined and calculated. Using an indicator with a standardized universal definition can facilitate benchmarking at later stages of monitoring, because other populations may have comparable data about the indicator. Box 3.4 contains examples of global health indicator lists.
BOX 3.4. Examples of global health indicator lists
The following are examples of global lists of health indicators, spanning different topics:
The WHO Global reference list of 100 core health indicators compiles universal indicators and corresponding definitions related to health status, risk factors, service coverage and health systems (4). The indicators reflect current public health priorities for global monitoring. The initial list was published in 2015 and updated in 2018.
The Global indicator framework for the Sustainable Development Goals and targets of the 2030 Agenda for Sustainable Development contains over 230 unique indicators that correspond to the 17 goals and 169 targets; 28 indicators pertain to the health goal (14). The Framework is accompanied by a list of desirable dimensions of inequality by which to disaggregate each indicator.
The WHO Operational framework for monitoring social determinants of health equity specifies a menu of indicators for monitoring social determinants of health, spanning six domains: economic security and equality; education; physical environment; social and community context; health behaviours; and health care (15). See Chapter 9 for more on the Operational Framework.
The WHO Primary health care measurement framework and indicators contains a menu of indicators to track and monitor progress in strengthening primary health care-oriented health systems as an accelerator towards universal health coverage and the SDGs (16). Some indicators are specified for global monitoring. National and subnational policy-makers and planners can choose a subset of indicators from the menu based on consideration of respective country contexts.
The WHO Mother and Newborn Information for Tracking Outcomes and Results Online Indicator Toolkit is a database of 167 core, aspirational and optional indicators related to maternal and newborn health (17).
The Indicator Registry is a central database of information for indicators used to track the HIV epidemic across global, regional and national levels (18). It includes universal definitions and indicators endorsed by a wide range of multilateral agencies and international organizations, including the Global Fund to Fight AIDS, Tuberculosis and Malaria, the Joint United Nations Programme on HIV/AIDS, the United Nations Children’s Fund, the United States President’s Emergency Plan for AIDS Relief and WHO.
In some cases, context-specific health indicators may be appropriate to reflect the unique circumstances of the monitored population. For example, universal health indicator definitions may be adapted for enhanced relevance within a local context, or new indicators may be developed to reflect a specific priority. For more information about defining and constructing indicators using universal and context-specific indicator definitions, See Chapter 17.
Dimensions of inequality
Dimensions of inequality, sometimes termed equity stratifiers, refer to the criteria upon which population subgroups are categorized for health inequality monitoring. These subgroups serve as the basis of comparison for health inequality analysis. Some of the most used dimensions of inequality applicable across many health topics and populations include:
- demographic dimensions, such as age and sex;
- socioeconomic dimensions, such as economic status and education level;
- geographical dimensions, such as urban or rural place of residence and subnational region.
Health inequalities are described according to the selected dimension of inequality, such as economic-related inequalities in health or inequalities in health by sex (noting that economic inequality and sex inequality are distinct concepts – see Chapter 1).
There are a multitude of other dimensions that may be applicable for health inequality analyses, depending on the context and data availability, including caste or tribe, disability status, ethnicity or race, languages spoken, migratory status, occupation, religion, and sexual orientation and gender identity. The PROGRESS-Plus framework summarizes dimensions of inequality that are commonly applied in inequality studies (Box 3.5).
Data on health or determinants of health that are specific to population subgroups are termed disaggregated health data.
BOX 3.5. PROGRESS-Plus framework
The acronym PROGRESS was first proposed in 2003 by Evans and Brown in an exploration of equity considerations related to road traffic crashes (19). The acronym captures some of the most common dimensions of inequality applicable to health inequality monitoring: place of residence; race/ethnicity/culture/language; occupation; gender/sex;1 religion; education; socioeconomic status; and social capital.
The acronym was subsequently expanded to PROGRESS-Plus to capture additional context-specific dimensions such as age, disability, immigration/citizenship status, insurance status and sexual orientation (20).
1 The PROGRESS acronym includes gender and sex together as a matter of convention. These are, however, distinct concepts with different implications for measuring and acting upon inequalities in health.
There are several factors to consider when selecting dimensions of inequality for a given health inequality monitoring activity. The most relevant dimensions are those that are likely to reflect unfair differences in health between subgroups that could be corrected by making structural changes to policies, programmes and institutional practices, or by shifting harmful social norms and relations. For example, for certain diseases, comparing health outcomes across age groups may be indicative of the natural progression of the disease rather than an unfair and remediable inequality. If, however, monitoring seeks to explore age-related discrimination in access to essential health services, age would constitute an appropriate dimension. Likewise, health differences identified on the basis of sex (sex-related inequalities in health) may reflect biological differences or may stem from the interaction between sex and gender (i.e. the socially constructed norms, roles, behaviours and relations among and between boys, gender diverse people, girls, men and women). See Box 3.6 for more on gender inequality and discrimination.
BOX 3.6. Gender inequality and discrimination
Gender inequalities and discrimination hinder progress to fulfil everyone’s right to health (21). Gender norms, roles and relations influence, and are influenced by, individual identity, interpersonal relationships, institutional structures and institutions. Harmful gender norms related to notions of masculinity or femininity in different cultures can negatively affect health and well-being. Women and girls are often disproportionately impacted by these, resulting in significant barriers to accessing health information and services throughout the world. Gender equality refers to equal capacities and opportunities to access and control all social, economic and political resources (e.g. health services, education, voting rights) and includes protection under the law to ensure such access. Gender equity refers to fairness and considers people’s different needs to achieve gender equality. This may mean different treatment is needed to ensure equality of opportunity.
Addressing gender-based discrimination and harmful gender norms, along with other intersecting forms of discrimination related to ethnicity, socioeconomic status, disability, age, geographical location, sexual orientation and other factors, remains a critical aspect of enhancing health, access to care and health-care experiences of all people.
Understanding how health indicators vary across population subgroups – that is, how they are equal or unequal – leads to questions such as: Why do differences exist? What are their root causes? Are they justified?
The selection of dimensions of inequality should consider whether it is relevant to the corresponding health topic and indicator. In some cases, certain dimensions may not be applicable – for example, disaggregating data about the use of maternal health services by the sex of the individual or sex of the child is not relevant. Likewise, there are certain limitations when selecting dimensions of inequality for monitoring social determinants of health indicators (See Annex 1).
Box 3.7 presents general considerations for selecting relevant dimensions of inequality that correspond to the four components of the Monitoring, Evaluation and Review Framework, highlighting how data availability is another key consideration.
BOX 3.7. Dimensions of inequality corresponding to the four components of the Monitoring, Evaluation and Review Framework
The following considerations are relevant when selecting dimensions of inequality across the four components of the Monitoring, Evaluation and Review Framework.
Input and process indicators related to health financing, governance and information are sometimes available only at the national level, in which case they would not be applicable when monitoring within-country health inequality. If indicators are available at the subnational level, geographical dimensions of inequality may be particularly relevant (e.g. health workforce indicators may be disaggregated by district).
Output indicators, such as indicators related to the availability, accessibility, and quality of health service, are often disaggregated by geography along with other setting-specific relevant dimensions (e.g. public- versus private-sector facilities).
Outcome indicators, such as health intervention coverage, and impact indicators, such as health status, can often be disaggregated by four or five common inequality dimensions (e.g. age, economic status, education level, place of residence or sex) plus relevant setting-specific inequality dimensions. The selection of inequality dimensions depends on the data source and data availability. When using data from household surveys, numerous inequality dimensions can be used. For administrative or facility data sources, the availability and accessibility of data about inequality dimensions may be more limited.
Assessing how SDH are experienced by populations can help to inform the selection of relevant dimensions of inequality. The selection of dimensions of inequality should involve consultation with relevant stakeholders, such as knowledge users and affected communities, to understand and account for their interests and needs. Reviewing global initiatives and existing monitoring reports and recommendations can give a sense of relevant dimensions of inequality for a particular topic or population, and the potential for inequality monitoring to generate impact. See Box 3.8 for an example of monitoring age-related inequality in HIV, and how this can be aligned with priorities of relevant policies and programmes.
BOX 3.8. Monitoring age-related inequality in HIV
Global HIV programmes often specify young people aged 15–24 years as a high-priority population. There are several initiatives and campaigns dedicated to advancing the interests of this group, demonstrating the importance of monitoring age-related inequalities and how age groupings for HIV have been previously categorized. The Millennium Development Goals included a focus on HIV in young people, with indicators to track the prevalence of HIV among people aged 15–24 years (indicator 6.1), and comprehensive correct knowledge of HIV among people of this age group (indicator 6.3) (22). The WHO State of inequality: HIV, tuberculosis and malaria report included a section dedicated to young people aged 15–24 years, including further age disaggregation as people aged 15–19 years and 20–24 years, and disaggregation by sex, education level and place of residence (23). The monitoring specifications for the SDG indicator 3.3.1 (related to new HIV infections) specifies data disaggregation by age, including groupings for 1–14 years, 15–24 years, 25–49 years, and 50 years and over (24).
The intended impact of inequality monitoring is another key consideration when selecting dimensions of inequality.
Monitoring age-related inequalities in HIV may be part of efforts to advocate for greater resource allocation for programmes targeting young people. In this case, highlighting the situation in young adults relative to other population groups might be particularly impactful. Alternatively, monitoring may be aiming to explore the burden of HIV during infancy and childhood, or to show variations in service access throughout adulthood.
Recommended dimensions of inequality for global monitoring
Ideally, inequalities should be analysed and reported using all relevant dimensions of inequality for which data are available. PROGRESS-Plus offers a general framework of dimensions of inequality (see Box 3.5), but other guidance provides more concrete suggestions for different applications of inequality monitoring. For example, World Health Assembly Resolution 62.14 calls on Member States to “monitor and measure the health of national populations, with disaggregated data such as age, gender, ethnicity, race, caste, occupation, education, income and employment where national law and context permits so that health inequities can be detected and the impact of policies on health equity measured” (25). The United Nations General Assembly has stated the importance of considering cross-cutting dimensions of inequality for monitoring SDG indicators, including, “where relevant, income, sex, age, race, ethnicity, migratory status, disability and geographic location, or other characteristics, in accordance with the Fundamental Principles of Official Statistics” (26).
In addition to these global recommendations, other dimensions of inequality are important within certain contexts. Disaggregated data may be useful to expose how minority subgroups experience health in comparison with the larger population. For example, indigeneity is a relevant inequality dimension in many countries, including Australia (Box 3.9). Approaches to define, measure and categorize inequality dimensions may also be context-specific – and even within a single setting, there is often no standard agreement. For example, relevant categories for caste, ethnicity and race vary from country to country, and there are different perspectives on how these are defined and understood (31). See Chapter 17 for more on the measurement and categorization of inequality dimensions, including indices that combine multiple dimensions of inequality.
BOX 3.9. Indigeneity as a dimension of inequality in Australia
Indigeneity is a relevant dimension of inequality in Australia. Data disaggregated by indigenous status permit analysis of inequalities between Aboriginal and Torres Strait Island peoples versus non-Indigenous peoples. As of 2021, a minority of the total population of Australia, about 3.8%, were Aboriginal and Torres Strait Island peoples (27). There are entrenched health inequalities between non-Indigenous Australians and Aboriginal and Torres Strait Island peoples, which are evident when data for these two groups are compared:
A higher percentage of non-Indigenous children were born at a healthy birthweight than Aboriginal and Torres Strait Islander children, with a gap of 4.6 percentage points (94.2% versus 89.6%, respectively) (28).
A review of adolescent health and well-being reported that almost a third of Indigenous adolescents experienced psychological distress, which was twice the non-Indigenous rate, with marked inequalities also evident across other aspects of health (29).
Recognizing the complex factors underlying these inequalities and the urgent need for collaborative, remedial actions, the Coalition of Aboriginal and Torres Strait Islander Peak Organisations and all the Australian governments endorsed the National Agreement on Closing the Gap in 2020 (30).
Exploring intersectionality
Recognizing that people have multiple characteristics, experiences and situational factors, a single dimension of inequality may not always be sufficient to meaningfully capture inequality within a population. Intersectionality is a concept describing how interconnected dimensions of inequality (especially race/ethnicity, income/wealth and gender) interact to create different experiences of privilege, vulnerability or disadvantage (32). For example, although health experiences may differ between urban and rural populations, there may also be inequalities in health between rich and poor subgroups in urban areas. Moreover, ethnic minority groups in poor urban areas may be particularly disadvantaged when it comes to health.
In the context of health inequality monitoring, double or multiple disaggregation is a starting point for exploring intersectionality (33). Double disaggregation involves applying two dimensions of inequality simultaneously, and multiple disaggregation applies more than two dimensions. Applying double or multiple disaggregation helps to account for experiences of compounding forms of inequality that, when combined, can generate increased risk. Box 3.10 demonstrates the application of double disaggregation to explore health inequalities in urban and rural areas by race/ethnicity and sex. For more on the preparation of data according to multiple dimensions of inequality, See Chapter 17. Chapter 25 addresses the use of multiple regression analysis to explore intersectionality.
BOX 3.10. Examples of double disaggregation
The following examples demonstrate data disaggregated by two dimensions of inequality as a means to deepen explorations of place of residence inequalities.
Figure 3.3 shows age-adjusted death rates among adults in counties in the United States of America, which are classified as urban or rural. The data are further disaggregated by race/ethnicity (34). The urban/rural disaggregated data demonstrate higher death rates in rural counties. Double disaggregation by race/ethnicity, however, shows that this gap existed for all subgroups, with the largest rural/urban gap among the American Indian/Alaska Native subgroup.
FIGURE 3.3. Age-adjusted death rates per 100 000 population among adults aged 25–64 years, by rurality of county of residence and race/ethnicity, United States of America
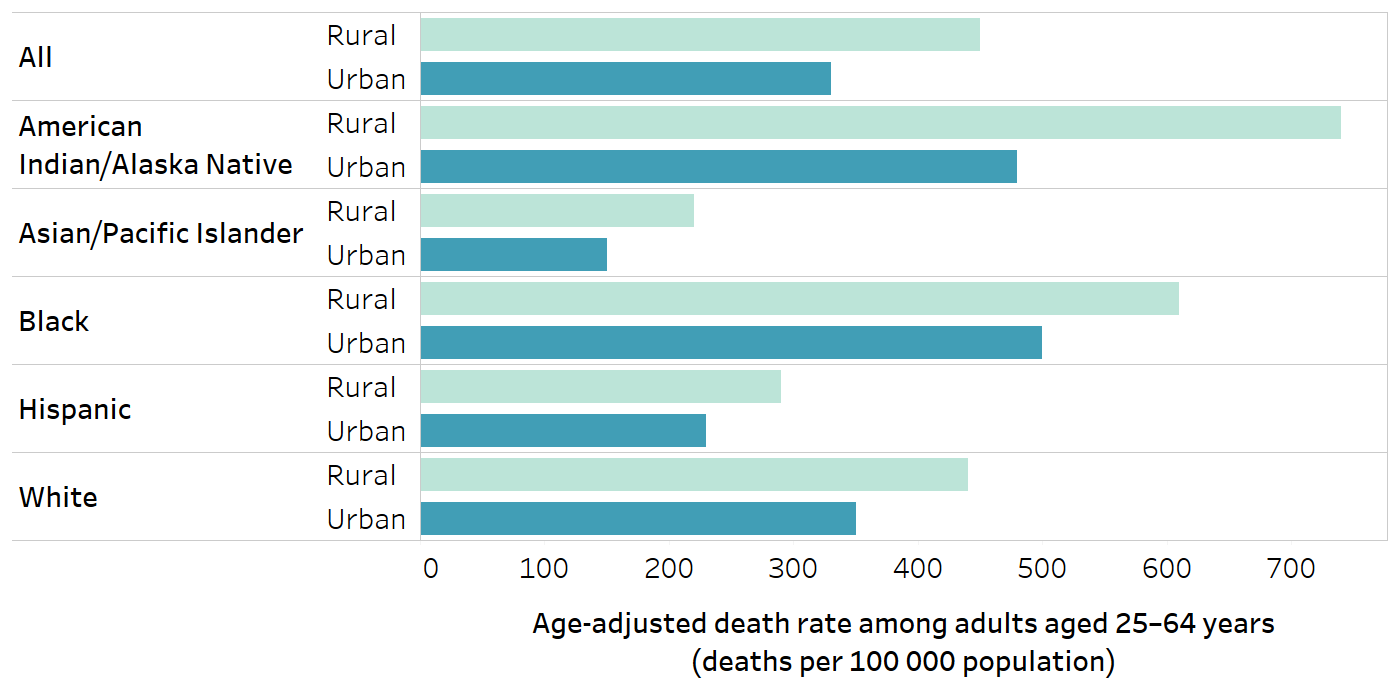
Race/ethnicity groupings, including the classifications and their names, were retained from the source.
Source: Probst, Eberth and Crouch (34), with data from 2017.
Figure 3.4 provides data about literacy rates among people in urban and rural area in Liberia, additionally disaggregated by sex. Although literacy rates were higher in urban than rural areas overall – and higher among men than women within each area – double disaggregation demonstrated a gap of 59.7 percentage points between urban men and rural women. It was also apparent that urban women and rural men reported similar literacy rates. For more on health inequality monitoring considerations in rural and remote areas, See Chapter 5.
FIGURE 3.4. Literacy rates, by place of residence and sex, Liberia 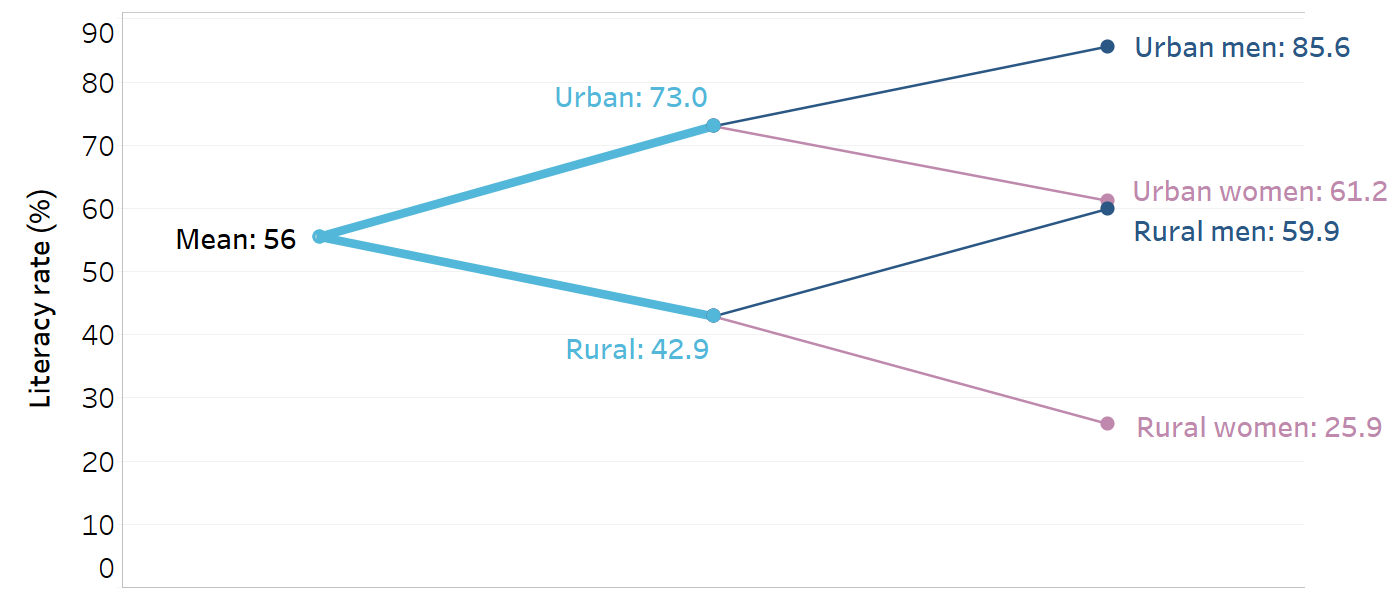
Literate describes people who attended secondary school or higher or can read a whole sentence or part of a sentence.
Source: United Nations System Chief Executives Board for Coordination (35), with data from the 2007 Demographic and Health Surveys.
Example: selecting topics, health indicators and dimensions of inequality
The WHO report State of health inequality: Indonesia was developed with the overall aims of quantifying the magnitude of health inequalities across health topics and dimensions of inequality, and identifying priority areas for action and their policy implications (36). The process of preparing the report brought together a dedicated group of stakeholders across several institutions, who were involved in the selection of relevant health topics, health indicators and dimensions of inequality.
The report analysed inequality across 11 health topics: a public health development index and sub-indices; reproductive health; maternal, newborn and child health; childhood immunization; child malnutrition; child mortality; infectious diseases; environmental health; noncommunicable diseases, mental health and behavioural risk factors; disability and injury; and health facilities and personnel. National priorities and data availability played a role in the selection of the topics.
Across the topics, 53 relevant indicators were identified, considering data availability, relevance and importance to the health topic, and representation of diverse aspects of the topic. For inclusion in the report, data about the health indicator had to be available nationally, with disaggregated data available by at least one relevant dimension of inequality. The relevance and importance of the indicator were determined through consultations with health topic experts. Consideration was given to the importance of the indicator in the context of global initiatives as well as their importance in the country context of Indonesia. As a result, some of the health indicators reflect global definitions (e.g. child malnutrition and child mortality indicators), and other indicator definitions were adapted or constructed specifically for the Indonesian context (e.g. the public health development index).
A variety of dimensions of inequality were featured in the report, including age, economic status, education, employment status, occupation, place of residence, sex and subnational region. The selection of dimensions of inequality was informed by data availability and the relevance to the health topic and indicator. For example, inequality related to subnational region was explored for all topics, as these data were widely available and applicable. Employment status of the household head was applied to a smaller subset of indicators, mainly related to child malnutrition.
References
1. Evidence, policy, impact: WHO guide for evidence-informed decision-making. Geneva: World Health Organization; 2021 (https://iris.who.int/handle/10665/350994, accessed 23 September 2024).
2. Basic documents: forty-ninth edition (including amendments adopted up to 31 May 2019). Geneva: World Health Organization; 2020 (https://iris.who.int/handle/10665/339554, accessed 23 September 2024).
3. Social determinants of health. Geneva: World Health Organization (https://www.who.int/health-topics/social-determinants-of-health, accessed 20 June 2024).
4. 2018 global reference list of 100 core health indicators (plus health-related SDGs). Geneva: World Health Organization; 2018 (https://iris.who.int/handle/10665/259951, accessed 23 September 2024).
5. Bergen N, Kirkby K, Fuertes CV, Schlotheuber A, Menning L, Mac Feely S, et al. Global state of education-related inequality in COVID-19 vaccine coverage, structural barriers, vaccine hesitancy, and vaccine refusal: findings from the Global COVID-19 Trends and Impact Survey. Lancet Glob Health. 2023;11(2):e207–e217. doi:10.1016/S2214-109X(22)00520-4.
6. Monitoring, evaluation and review of national health strategies: a country-led platform for information and accountability. Geneva: World Health Organization; 2011 (https://iris.who.int/handle/10665/85877, accessed 20 June 2024).
7. Strategizing national health in the 21st century: a handbook. Geneva: World Health Organization; 2016 (https://iris.who.int/handle/10665/250221, accessed 20 June 2024).
8. Health Metrics Network. Framework and standards for country health information systems, 2nd edition. Geneva: World Health Organization; 2008 (https://iris.who.int/handle/10665/43872, accessed 15 May 2024).
9. Inequality monitoring in immunization: a step-by-step manual. Geneva: World Health Organization; 2019 (https://iris.who.int/handle/10665/329535, accessed 20 June 2024).
10. Barclay M, Dixon-Woods M, Lyratzopoulos G. The problem with composite indicators. BMJ Qual Saf. 2019;28:338–44. doi:10.1136/bmjqs-2018-007798.
11. Zeroing in on zero-dose. Geneva: Gavi, the Vaccine Alliance; 2024 (https://www.gavi.org/vaccineswork/zeroing-zero-dose, accessed 11 June 2024).
12. Wehrmeister FC, Barros AJD, Hosseinpoor AR, Boerma T, Victora CG. Measuring universal health coverage in reproductive, maternal, newborn and child health: an update of the composite coverage index. PLoS One. 2020;15(4):e0232350. doi:10.1371/journal.pone.0232350.
13. Hogan DR, Stevens GA, Hosseinpoor AR, Boerma T. Monitoring universal health coverage within the Sustainable Development Goals: development and baseline data for an index of essential health services. Lancet Glob Health. 2018;6(2):e152–e168. doi:10.1016/S2214-109X(17)30472-2.
14. Global indicator framework for the Sustainable Development Goals and targets of the 2030 Agenda for Sustainable Development. New York: United Nations Department of Economic and Social Affairs (https://unstats.un.org/sdgs/indicators/indicators-list/, accessed 28 May 2024).
15. Operational framework for monitoring social determinants of health equity. Geneva: World Health Organization; 2024 (https://iris.who.int/handle/10665/375732, accessed 23 September 2024).
16. Primary health care measurement framework and indicators: monitoring health systems through a primary health care lens. Geneva: World Health Organization; 2022 (https://iris.who.int/handle/10665/352205, accessed 23 September 2024).
17. Mother and newborn information for tracking outcomes and results: online indicator toolkit. Geneva: World Health Organization (https://monitor.srhr.org/, accessed 11 June 2024).
18. Indicator registry. Geneva: Joint United Nations Programme on HIV/AIDS 2024 (https://indicatorregistry.unaids.org/, accessed 11 June 2024).
19. Evans T, Brown H. Road traffic crashes: operationalizing equity in the context of health sector reform. Inj Control Saf Promot. 2003;10(1–2):11–12. doi:10.1076/icsp.10.1.11.14117.
20. O’Neill J, Tabish H, Welch V, Petticrew M, Pottie K, Clarke M, et al. Applying an equity lens to interventions: using PROGRESS ensures consideration of socially stratifying factors to illuminate inequities in health. J Clin Epidemiol. 2014;(1):56–64. doi:10.1016/j.jclinepi.2013.08.005.
21. Gender and health. Geneva: World Health Organization (https://www.who.int/health-topics/gender, accessed 20 June 2024).
22. Official list of MDG indicators. New York: United Nations; 2009 (https://www.un.org/womenwatch/daw/egm/impact_bdpfa/informational/BP2%20-%20MGDSOfficialList2008.pdf>, accessed 3 September 2024).
23. State of inequality: HIV, tuberculosis and malaria. Geneva: World Health Organization; 2021 (https://iris.who.int/handle/10665/350198, accessed 23 September 2024).
24. SDG indicator metadata. New York: United Nations Statistics Division; 2024 (https://unstats.un.org/sdgs/metadata/files/Metadata-03-03-01.pdf>, accessed 3 September 2024).
25. Resolution WHA62.14. Reducing health inequities through action on the social determinants of health. Geneva: World Health Organization; 2009 (https://iris.who.int/handle/10665/2257, accessed 23 September 2024).
26. Resolution 68/632. Global indicator framework for the Sustainable Development Goals and targets of the 2030 Agenda for Sustainable Development. New York: United Nations General Assembly; 2017 (https://unstats.un.org/sdgs/indicators/Global%20Indicator%20Framework%20after%202022%20refinement_Eng.pdf>, accessed 11 June 2024).
27. Estimates of Aboriginal and Torres Strait Islander Australians. Belconnen, ACT: Australian Bureau of Statistics; 2021 (https://www.abs.gov.au/statistics/people/aboriginal-and-torres-strait-islander-peoples/estimates-aboriginal-and-torres-strait-islander-australians/latest-release, accessed 11 June 2024).
28. Socio-economic outcome area 2: Aboriginal and Torres Strait Islander children are born health and strong. Melbourne: Australian Government Productivity Commission; 2021 (https://www.pc.gov.au/closing-the-gap-data/dashboard/se/outcome-area2, accessed 11 June 2024).
29. Azzopardi PS, Sawyer SM, Carlin JB, Degenhardt L, Brown N, Brown AD, et al. Health and wellbeing of Indigenous adolescents in Australia: a systematic synthesis of population data. Lancet. 2018;391(10122):766–782. doi:10.1016/S0140-6736(17)32141-4.
30. National agreement on closing the gap. Coalition of Aboriginal and Torres Strait Islander Peak Organisations, Australian Governments; 2020 (https://www.closingthegap.gov.au/sites/default/files/2022-09/ctg-national-agreement_apr-21-comm-infra-targets-updated-24-august-2022_0.pdf>, accessed 11 June 2024).
31. Lu C, Ahmed R, Lamri A, Anand SS. Use of race, ethnicity, and ancestry data in health research. PLOS Glob Public Health. 2022;2(9):e0001060. doi:10.1371/journal.pgph.0001060.
32. Incorporating intersectional gender analysis into research on infectious diseases of poverty: a toolkit for health researchers. Geneva: World Health Organization; 2020 (https://iris.who.int/handle/10665/334355, accessed 23 September 2024).
33. Palència L, Malmusi D, Borrell C. Incorporating intersectionality in evaluation of policy impacts on health equity: a quick guide. Barcelona: Agència de Salut Pública de Barcelona; 2014 (http://www.sophie-project.eu/pdf/Guide_intersectionality_SOPHIE.pdf, accessed 11 June 2024).
34. Probst J, Eberth JM, Crouch E. Structural urbanism contributes to poorer health outcomes for rural America. Health Aff (Millwood). 2019;38(12):1976–1984. doi:10.1377/hlthaff.2019.00914.
35. Leaving no one behind: equality and non-discrimination at the heart of sustainable development. New York: United Nations System Chief Executives Board for Coordination; 2017 (https://unsceb.org/sites/default/files/imported_files/CEB%20equality%20framework-A4-web-rev3_0.pdf>, accessed 10 June 2024).
36. State of health inequality: Indonesia. Geneva: World Health Organization; 2017 (https://iris.who.int/handle/10665/259685, accessed 23 September 2024).